

Energy Musings - April 5, 2022

Energy Musings contains articles and analyses dealing with important issues and developments within the energy industry, including historical perspective, with potentially significant implications for executives planning their companies’ future. While published every two weeks, events and travel may alter that schedule. I welcome your comments and observations. Allen Brooks
The Challenge EVs Face With Raw Material Inflation
The EV revolution is underway and promoted by the Biden administration. Inflation in the raw materials used in EVs has caused Tesla to raise prices and others to warn about higher costs.
Joe Biden Promises U.S. LNG To Help Europe – Realistic?
The U.S. and E.U. have agreed to work together to boost U.S. LNG shipments to Europe to help get them off Russian natural gas. Plans sound good, but what is the reality of them happening?
Offshore Wind Performance Questions Depending On Them
A review of the U.K.’s January’s daily offshore wind output shows significant variability. We examined monthly offshore wind’s performance against capacity that showed utilization issues.
Random Energy Topics Of Note
Are We Moving More Or Less, And What Does It Mean?
High oil prices have analysts concerned about demand destruction. We look at data.
Joe Biden Dips Into The SPR One More Time
A massive release of SPR oil by Biden is an attempt to win votes in the midterm election.
The Challenge EVs Face With Raw Material Inflation
“Looking to Buy and EV? Get on a Wait List.” That was the title of a recent article in The Wall Street Journal highlighting the growing demand for electric vehicles (EV). The gist of the article was that because people were having to wait for new EVs (as well as conventional cars), the use of wait lists so customers were assured of a high spot in the ranks of people clamoring for a popular vehicle has become a new tool for auto manufacturers. In fact, Ford CEO Jim Farley was quoted in the article stating that opening reservations when they hold an onstage vehicle introduction “has become the company’s primary way of creating buzz and gauging consumer interest in a future model.” Doesn’t every marketing executive want an instant measure of a new product’s success? It certainly helps in setting manufacturing plans.

Exhibit 1. An Infamous Edsel Convertible – Ford’s Disastrous Car Project SOURCE: Time.com
We thought about how Ford might have benefitted from such a marketing approach back in September 1957 when it introduced the Edsel, named for Henry Ford’s son. The company had spent 10 years and $250 million on planning one of its first brand new cars. The car came in 18 models but, to reach its sales goals, it would have to sell wildly better than any other car in 1957 was expected to do. Two years later the Edsel was abandoned as an abject failure.
In 2014, Time magazine authored an article titled: “What Happened to the Car Industry's Most Famous Flop?” The following is the heart of the article with implications for the EV industry.
As it turned out, the Edsel was a classic case of the wrong car for the wrong market at the wrong time. It was also a prime example of the limitations of market research, with its “depth interviews” and “motivational” mumbo-jumbo. On the research, Ford had an airtight case for a new medium-priced car to compete with Chrysler’s Dodge and DeSoto, General Motors’ Pontiac, Oldsmobile, and Buick. Studies showed that by 1965 half of all U.S. families would be in the $5,000-and-up bracket, would be buying more cars in the medium-priced field, which already had 60% of the market, and Edsel could sell up to 400,000 cars a year.
After the decision was made in 1955, Ford ran more studies to make sure the new car had precisely the right “personality.” Research showed that Mercury buyers were generally young and hot-rod-inclined, while Pontiac, Dodge and Buick appealed to middle-aged people. Edsel was to strike a happy medium. As one researcher said, it would be “the smart car for the younger executive or professional family on its way up.” To get this image across, Ford even went to the trouble of putting out a 60-page memo on the procedural steps in the selection of an advertising agency, turned down 19 applicants before choosing Manhattan’s Foote, Cone & Belding. Total cost of research, design, tooling, expansion of production facilities: $250 million.
A Taste of Lemon. The flaw in all the research was that by 1957, when Edsel appeared, the bloom was gone from the medium-priced field, and a new boom was starting in the compact field, an area the Edsel research had overlooked completely.
Note that Ford’s research supporting the Edsel concept was based on “depth interviews.” That was how advertisers assessed the potential success of new products and planned their advertising campaigns. That data was paired with economic and demographic studies that showed families’ incomes would be rising and they would be buying more cars, especially medium-priced ones. Ford also assessed their competitors’ products and which population segments they appealed to. Based on all this research, Ford targeted the Edsel for the middle market, which was expected to be growing. The disaster came because Ford researchers totally missed the more rapidly growing compact auto segment of the auto industry.
The EV industry was born on the concept of a fun vehicle to drive that was “environmentally friendly” would find a market niche – especially in environmentally sensitive California. Historically, many American social trends and mores emerged from California before spreading nationwide and then internationally. Tesla was founded in 2003 in San Carlos, California. California remains the center of the American EV industry with nearly half the domestic EV fleet registered in the state.

Exhibit 2. The California And U.S. EV Car Market SOURCE: Veloz.com
It is interesting that the pace of EV sales in California appears to be slowing, probably due to increased saturation of the market – most early adopters have their EV. According to the above data, California EV sales in 2021 accounted for 39.9% of total industry EV sales. In turn, total EV sales represented only 4.3% of total light duty vehicle sales last year. When we consider cumulative EV vehicle sales for 2011-2021 of 2,415,587 units, it represented only 1.4% of total vehicle sales.
The attraction of battery electric vehicles (BEV) is that they do not produce any carbon emissions when driven. A ticket to a net zero world. Even plug-in hybrid electric vehicles (PHEV) have a motor that generates emissions. But the problem for these vehicles and achieving the net zero world is their cost. EV costs are dictated by the economics of their batteries, which are dependent on the cost of the rare earth materials they use.
Simon Moores, CEO of Benchmark, a mining commodities research firm, recently commented on the challenge facing EVs. “When raw materials prices go up, lithium-ion battery prices go up, and EV prices go up. In 2015, raw materials were 40% the cost of a lithium-ion battery. Today they are 80%.” That has huge implications for the future growth of EVs and the strategies of governments and the auto industry.
The EV industry became convinced that the 3%-7% annual declines in battery costs seen for the past several decades would continue, driving EV costs to competitive levels with internal combustion engine (ICE) vehicles. With their environmental advantage, EVs were the solution to the decarbonization of personal transportation and eventually the movement of goods around the country. That scenario has been called into question by the rapid increase in demand for the metals that are critical to building EVs. The demand has also highlighted the reality that most of the current and near-term supply of these metals and their processing facilities is in a handful of countries. Some of them have lower personal safety and social welfare standards than western countries, thus making doing business with them a questionable business proposition.
For EVs and other renewable energy equipment – wind turbine motors and solar panels – rare earth elements (REE), or rare earth minerals as they are often referred to, are critical. They help power most electronic devices such as smartphones, tablets, and smart speakers.
REEs is a group of 17 chemical elements found together in the periodic table. The group consists of yttrium and the 15 lanthanide elements (lanthanum, cerium, praseodymium, neodymium, promethium, samarium, europium, gadolinium, terbium, dysprosium, holmium, erbium, thulium, ytterbium, and lutetium). The 17th element, scandium, is found in most REE deposits and is sometimes classified as a member of this group.
REEs are not actually “rare,” and are found in many countries including the U.S. However, they are difficult to mine safely. About a third of the world’s REE deposits are in China, and it controls more than 90% of the world’s production of these REEs, due to lower labor costs and less stringent environmental regulations.

Exhibit 3. Evolution Of The Global Rare Earth Minerals Market SOURCE: Geology.com
The chart above shows the history of REE production, measured in metric tons of rare earth oxide equivalent. It shows the entry of the U.S. into this market in the mid-1960s when color television exploded demand. Starting in the mid-1980s, China began selling REEs at low prices forcing U.S. mines to shut down. When China cut exports in 2010, it helped new mine production in many countries of the world including the U.S., Australia, Russia, Thailand, Malaysia, and others. In 2018, production data from Burma/Myanmar became available, boosting the Other output sector.
It is important to understand, as a U.S. Geological Survey (USGS) report pointed out, that “China has strategically flooded the global market with rare earths at subsidized prices, driven out competitors, and deterred new market entrants.” This means the global REE industry can easily be upset by the competitive actions of China.
The following chart shows the global distribution of REE reserves and the 2020 mine production by leading countries. Doing business with the countries with the largest reserves of REEs is a challenge. The U.S. has 1.5 million tons of reserves but is almost completely dependent on China for processing the metals.

Exhibit 4. Location Of Rare Earth Mineral Deposits SOURCE: visualcapitalist.com

Exhibit 5. U.S. Rare Earth Mineral Imports By Country SOURCE: Geology.com
Our dependence on China is highlighted in the above chart showing the distribution of REE imports by country. Altering this dependency will require significant time and investment. The importance of REEs to the U.S. is shown in the following chart showing where they are used.

Exhibit 6. How Rare Earth Minerals Are Used Source: Geology.com
Other than hearing about the importance of REEs in today’s modern world, most people are ignorant of how critical they are to their everyday lives. For example, many vehicles use REEs in the catalysts of their pollution control systems. Many metal alloys are made stronger and more durable by the addition of REEs. Phosphors used in digital displays, monitors, and televisions are created with REEs, making them integral to the manufacture of computers and cell phones, along with other high-tech products. Optical quality glass, granite, marble, and gemstones are often polished with cerium oxide powder, a REE derivative .
Several pounds of REE compounds are used in the batteries that power every BEV, HEV, and PHEV. Climate change, energy independence, and government mandates are driving demand for EVs. With large EVs entering the market and demand for greater EV range, larger battery packs to power them will cause REE demand to grow even faster. Consumer products and construction materials and products are all projected to grow, adding to future market demand for REEs. Extracting pounds of REEs means mining thousands of tons of ore. To date, substituting other substances for REEs in their most important uses usually have proven less effective and more costly.
Often overlooked in the discussion about REEs is the impact the clean energy transition will have on copper. Copper is essential in modern-day electrical systems because it has superior conductivity over other possible metals, which is crucial in the collection, storage, transmission, and distribution of energy. It is highly malleable, meaning it can be bent, twisted, and formed into countless shapes. It is also recyclable, without losing any of its capabilities. Copper is essential for the clean energy technologies being relied on for our energy transition.
EVs require about four times more copper than an ICE vehicle. There are approximately five tons of copper per megawatt (MW) of renewable energy systems. Offshore wind turbines require about 28,000 kilograms (kg) of copper, the equivalent of 31 tons. These renewable energy systems are using up to 12 times more copper than in traditional energy systems. Unless the green revolution slows, demand for copper will grow rapidly.
Copper demand has grown throughout history as shown in the following chart. Copper is referred to in commodity, economic, and investment circles as “Dr. Copper,” as its health – pricewise – is judged to be a predictor of future economic activity.

Exhibit 7. History Of The World’s Copper Market SOURCE: Geology.com
Although copper demand appears to have risen steadily throughout history, copper prices have shown a different pattern. As the chart below shows, from 1960 until the early 2000s, although cyclical, copper prices traded in a narrow and low-price range. We assume it was because demand growth was moderate and new mines were brought into production enabling supply growth to moderate price increases. With the Chinese economic miracle exploding commodity demand in the early 2000s, copper prices soared with increased volatility. This trading pattern reflects the greater demand and increased difficulty in adding additional supply. (We calculated that during March, copper futures rose 6.9%, which would add to the price spike in this chart.)

Exhibit 8. Long-term History Of Copper Prices SOURCE: tradingeconomics.com
Recent investment and economic reports have focused on answering the question of whether we are in a copper supercycle? As one study suggested, usually a structural shift in the economy is needed to drive a supercycle. That may be the case now as major economies switch from fossil fuels to renewable energy and strive for sustainability. Given the amount of copper necessary to power such a shift, producers will be challenged to find and bring more supply into production to meet the increased demand. The International Energy Agency (IEA) said in a report last year that it takes an average of 16 years to bring new mines into production. This is not helpful as economies experience increasing inflation.
A report looking at the issue of the copper supercycle contained the following chart showing the nominal price for copper and its inflation-adjusted price. Current copper prices are rising at a rate more like they did during the China Supercycle of 2004-2010. That cycle saw copper prices rise considerably faster than during the Asian Supercycle of 1985-1993 and the Post War Supercycle of 1950-1980.

Exhibit 9. Previous Copper Supercycles SOURCE: Roskill
Julian Kettle, Senior Vice President, Vice Chair Metals and Mining of consultant Wood Mackenzie, recently wrote: “A supercycle driven by an accelerated decarbonization pathway points to rising rather than falling prices for certain key raw materials.” Price increases will either be restrained, or they will drive EV manufacturers to shift battery chemistries to help mitigate the cost increases driven by raw material price hikes. Wood Mackenzie recently upped its forecast for BEV growth to nearly a tripling of units between 2021 and 2026. They also foresee a healthy growth in the number of HEVs but acknowledge that those vehicles are not as intensive consumers of REE and copper as are BEVs.

Exhibit 10. Rising EV Material Costs Could Upset Market Growth SOURCE: Morgan Stanley
Investment bank Morgan Stanley maintains a battery input tracker chart. The most recent version of the chart is above. It shows that raw material costs began climbing in the fall of 2020 as the world’s economy was recovering from the Covid-19 lockdowns. Those increases have not only continued but have accelerated. There are no signs the cost increases are about to end or that they are moderating. We have seen Tesla increase its EV models’ prices twice so far this year, with a 5% hike the latest increase. Other renewable energy companies are being forced to increase their prices due to profitability challenges from more expensive raw material costs.
Recently, Martin Daum, CEO of Daimler Truck, the world’s largest truck manufacturer, told the Financial Times that rising raw material costs for electric heavy-duty vehicles, accelerating due to the Russia/Ukraine war, will make them “forever be higher” than ICE trucks without government subsidies. He told the newspaper, “If you take the entirety of engine, transmission, axle, tank system, cooling, we have a maximum of about €25,000 ($27,599) [of material in a combustion engine truck].” He went on saying, “How much battery do you get for €25,000? Even if [battery costs fall to] €60 ($66) per kilowatt hour, and I need 400 kilowatt hours, then I need €24,000 ($26,495) alone for the battery cells [in a single truck].” That is in addition to the cost of all the other components.
He added that it would be up to governments to make up the difference, using whichever mechanism they chose. “Without any subsidies…the price of an [electric] truck will always, forever be higher than a [combustion engine] truck.” That is a sobering message, but likely reflects the reality of the EV world today, especially for heavy-duty trucks. The FT article mentioned that Daimler Trucks was an early entrant into the electric vehicle market and has been manufacturing battery-powered heavy-duty vehicles since 2017. Daimler Trucks reported it had more than tripled the sales of zero-emission trucks and buses last year, to a total of 712. However, those represent a drop in that market segment when the company sold 455,000 trucks and buses in total in 2021.
The wave of raw material inflation had Daum calling for a carbon tax to narrow the cost disparity between ICE trucks and his EV trucks. With cobalt and lithium prices more than doubling in the past year, and nickel up about 40%, battery pack prices have stopped declining, and are likely heading higher. According to a survey by Bloomberg NEF, battery pack prices had fallen to an average of $132 per kilowatt-hour (kWh) last year. Now, they are predicted to remain above the $100/kWh threshold until at least 2024, a level considered critical for EVs to become competitive with ICE vehicles. With costs still rising, we question that prediction.
As Moores of Benchmark put it, “Raw materials and therefore mining is the limiting factor to EV production.” His firm also concluded that in the most optimistic scenario where every raw material project and expansion comes on stream, there will not be enough raw material for the battery supply chain in 2030. EV forecasts will prove way too optimistic, undercutting net zero commitments. That is an ominous message for EV manufacturers, as the mining industry has suffered the same fate as the oil and gas industry from years of under-investment, as well as being attacked by environmentalists attempting to restrict the development of new mines. The upheaval of supply chains, initially by the pandemic and now the fallout from the Russia/Ukraine war and Russian sanctions, is further delaying the development of new mines. In the U.S., the mining industry is being fought by the Biden administration over new mines just as the administration is restricting new oil and gas drilling permits. These battles are about several proposed new large mines that will be able to deliver REE and copper supplies for the domestic market. These battles are over environmental concerns. Even if the battles are resolved soon, it looks like there will be a brake applied to the pace of the EV revolution.
Joe Biden Promises U.S. LNG To Help Europe – Realistic?
At a special NATO meeting a week ago, European Commission (EC) President Ursula von der Leyen and U.S. President Joe Biden promised they would find a solution to the continent’s dependence on Russian natural gas for its electricity and heating. The solution calls for more U.S. liquefied natural gas (LNG) to find its way to European customers and for Europeans to reduce their natural gas consumption. There was a lot of happy talk during the press briefing, but the details of how the plan will achieve its near-term goal of getting 15 billion cubic meters (bcm) of U.S. LNG to Europe in 2022 will be left up to the Task Force for Energy Security about to be formed. The Task Force will be chaired by a representative from the White House and a representative appointed by the President of the European Commission. (For a point of reference, 15 bcm is about equal to 1.5 billion cubic feet per day (bcf/d) of natural gas.)
In keeping with Europe’s and the Biden administration’s green agendas, cutting natural gas use is a key component of the plan. The usual steps were spelled out in the White House Fact Sheet. Those include deploying more clean energy and boosting energy efficiency by installing smart thermostats and heat pumps. Getting people to stop using as much gas by turning down their thermostats or shifting to electric stoves was not mentioned, but the former may be the near-term adjustment people will need to make. The Fact Sheet stated it believed these efficiency measures could save the European Union (EU) 170 bcm/year of gas use by 2030. Europe used 510 bcm of gas last year, but that includes countries outside of the 27 members of the EU. The goal of reducing Europe’s gas use by a third, even though the target is eight years away, would eliminate all the Russian pipeline gas (155 bcm) supplied to Europe last year.
With respect to the LNG situation, the White House Fact Sheet stated: “The United States will work with international partners and strive to ensure additional LNG volumes for the EU market of at least 15 bcm in 2022, with expected increases going forward.” In Biden’s remarks at the press conference announcing the agreement, he highlighted the U.S. working with “our international partners” to achieve the additional 15 bcm of LNG for Europe to prevent residents from suffering this winter and next. His statement left open the possibility that not all the incremental LNG will necessarily be coming from the U.S., but no one is sure where it will come from.
The “carrot” in the plan for the U.S. is the pledge by the EC to work with its European Union (EU) members to ensure that “until at least 2030” there will be “demand for approximately 50 bcm/year of additional U.S. LNG that is consistent with our shared net-zero goals.” Given how much Russian gas needs to be backed out of the European market, this goal is certainly attainable. The timing is suspect if real progress is to be made in eliminating the threat of Russia using its gas supply as a weapon against European economies in the near-term. The plan acknowledges that gas prices will be determined by the market, which lets the politicians off the hook for escalating global gas prices.
We assume the additional LNG referenced in both the short- and long-term goals represents gas volumes above the 22 bcm of U.S. LNG delivered to Europe during 2021, although that is not clear. This January, the U.S. shipped a record 4.4 bcm of LNG to EU members, the U.K., and Turkey. This was possible as U.S. LNG exporters pumped flat out and the shorter distance to Europe permitted a parade of tankers crisscrossing the Atlantic Ocean. The chart below shows how the LNG tanker parade to Europe versus the handful of carriers traveling to Asia looked on ship-tracking apps.

Exhibit 11. The LNG Armada Bailing Out Europe’s Energy Business SOURCE: SeaRoutes.com
To put the travel times into perspective, we utilized the SeaRoutes.com ship route calculator and determined that the distance from New Orleans to Rotterdam, The Netherlands, is 4,786 nautical miles and takes an estimated 15.3 days of travel time, excluding loading and unloading time. On the other hand, going from New Orleans to Busan, Korea (the largest LNG importer in Asia), via the Panama Canal, requires traveling 9,954 miles and takes 30.6 days. At half the total sailing time to Europe and back, the domestic LNG industry can deliver more supply than tankers hauling the same volumes to Asia. The distance issue explains why so much LNG was moved to Europe in January, and why the U.S. may help Europe, assuming it has extra LNG available.
Surprisingly, while there was more U.S. LNG available in 2021 than in 2020, the share of export volumes going to Europe declined by about one percentage point (37% vs. 38%). The share going to Asia fell by two percentage points, with the share going to South America increasing. People forget that South America experienced a dry summer last year, which cut its hydroelectric power, which was made up by using more natural gas to generate electricity.
The chart below shows U.S. LNG cargoes by destination for the past four years. The impact of the natural gas crisis in Europe last year is shown by the large concentration of cargoes going there during November 2021–January 2022. Absent such a surge in LNG cargoes, Europe’s share of U.S. LNG would have fallen further than it did last year. While the armada of LNG tankers helping bail out Europe’s gas market received much media and industry attention, European customers have dominated U.S. LNG shipping in prior periods, most notably the winters of 2018-2019 and 2019-2020, and during the early months of 2021.

Exhibit 12. U.S. LNG Shipments Monthly By Cargo Destination SOURCE: NGI
Biden promised to speed up the approvals for new LNG export terminals, which will certainly be welcomed by the industry if it materializes. However, the approvals only kick-off the construction, which needs years to deliver an operating plant. There are also issues in getting approvals for new or expanded gas pipelines to haul feed-gas to LNG terminals. The shocking reversal of a recently approved greenhouse gas evaluation requirement for approving pipeline permits at the Federal Energy Regulatory Commission (FERC) days before the NATO special meeting may be a sign the federal government is modifying its agenda – at least slightly – to assist our European allies in avoiding a potential humanitarian crisis later this year.
The global gas crisis has upended a relatively stable industry. The upheaval is epitomized by Europe’s effort to rapidly transition from its primary gas supplier after decades of building the infrastructure to support such a supply chain. This upheaval will continue until sufficient additional gas supply and a new supply chain becomes available.
The nature of natural gas, where it is typically found, and customer demands have shaped the industry’s evolution. Initially, when natural gas was produced along with crude oil, unless there was a local need, it was burned (flared). Soon, pipelines were built to haul the gas from wells and fields to cities where it displaced dirty and unhealthful coal-gas used primarily for lighting.
Eventually, huge natural gas deposits were discovered in areas remote from demand, necessitating constructing pipelines to haul the gas over long distances. The economics of these gas deposits meant large volumes needed to be moved, necessitating constructing large diameter pipelines, which required creating large consuming markets to justify the pipeline’s cost. Wanting to tap closer gas fields that could not support the economics of global pipelines, the industry explored moving LNG in liquid form to increase its market.
In January 1959, Methane Pioneer, a converted World War II freighter containing five aluminum prismatic tanks, carried LNG from Lake Charles, Louisiana, to the U.K.’s Canvey Island. Several more cargoes were moved, convincing the industry that LNG tankers were a viable transportation option beyond pipelines.
With LNG ship technology confirmed, the British Gas Council explored importing LNG from Venezuela. However, when large gas finds in Libya and Algeria were announced, much closer to the U.K. than Venezuela, it was decided to import LNG from Algeria, making it the world’s first LNG exporting country. That trade dried up when Algerian LNG could not compete with the delivered cost of natural gas developed in the North Sea. The LNG industry then shifted its focus to the U.S.
As the 1950s and 1960s brought an explosion in natural gas use throughout the U.S., declining domestic gas production jeopardized the infrastructure investment and the developing gas markets. The supply crisis was caused by faulty federal regulation of the natural gas producing and pipeline industries. However, as the new gas markets were primarily in the Northeast, Mid-Atlantic and Southeast regions of the country, importing LNG via East Coast terminals was considered the industry’s best option to sustain and grow these regional gas markets. Therefore, during the second half of the 1970s, the U.S. gas industry began building LNG regassification terminals and LNG tankers, designed to bring gas from Algeria. The subsequent deregulation of the pipeline industry and elimination of gas price controls led to an explosion in gas supply that minimized the need for these LNG terminals.
The shale gas revolution of the 2000s resulted in a surplus of domestic gas that stimulated efforts to turn the LNG import terminals into export terminals by adding liquefying equipment.The ability to export LNG exists under provisions of The Natural Gas Act of 1938, however, various approvals are required. FERC has the authorization to site both import and export facilities in accordance with environmental guidelines. States also have authority to veto an approval decision by FERC by denying the plant’s environmental permits. The plant must also satisfy federal marine transportation and pipeline safety requirements. Lastly, the applicant for a new export terminal must receive a permit from the Department of Energy (DOE) that determines the total volume of natural gas to be exported in not in the public’s interest. Exports can go to any country with which the U.S. has a free trade agreement, however, countries without such an agreement must be approved by the DOE.
On March 17th, the Biden administration ruled that the two newest LNG export terminals that did not have permission to export to non-free trade agreement countries, were now free to export gas to any country, including all countries in Europe. This is the first tangible evidence of the government working to expand U.S. LNG trade to help the EU reduce its dependency on Russian gas supplies.
Currently, there are seven export terminals with two additional ones in startup mode. The established terminals are shown on the following FERC map.

Exhibit 13. Existing U.S. LNG Terminals SOURCE: FERC
The next FERC chart shows the two terminals starting up, along with the other LNG export terminals that have been approved but have not begun construction. One of those terminals – Driftwood LNG in Calcasieu, Louisiana – is reportedly beginning construction. The approved terminals are in the process of lining up financing, which requires offtake commitments from consumers. Lenders are reluctant to commit financing on spot market volumes, which currently are very profitable, but which could rapidly change given geopolitical developments and other industry events.
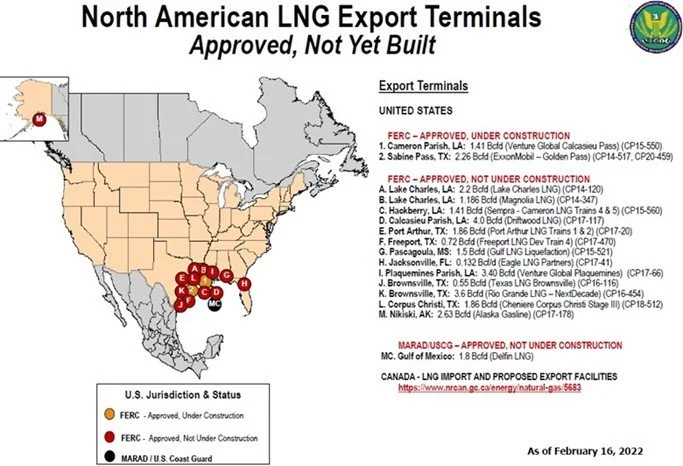
Exhibit 14. U.S. LNG Terminals Coming Onstream SOURCE: FERC
Once financing is secured, the terminals can begin construction, which can take years. In an early 2020 interview with The Houston Chronicle, Cheniere Energy’s CEO Jack Fusco discussed the construction of their five liquefaction trains at Sabine Pass and their two at Corpus Christi. “The analogy for us is that it takes 7-million manhours to build one of our liquefaction trains and it took 7-million manhours to build the Empire State Building,” he told the reporter. “So, we’ve effectively built seven Empire State Buildings in record-breaking time.”
Cheniere had built a regasification terminal at Sabine Pass in 2008. In 2010, it began the process to permit, build, and operate liquefaction facilities at Sabine Pass. After securing federal approvals and gas supply agreements, construction began in 2012 and the first LNG cargo departed in February 2016. That total process required six years, including nearly four years to construct LNG export facilities at an already built terminal location. Building new greenfield export terminals will take more than four years from start to finish.
Unless financing and supply agreements can be reached quickly, it is unlikely that U.S. LNG export capacity can expand much before 2025. Investment bank Goldman Sachs published a chart showing the history of U.S. LNG export capacity with its forecast of future capacity growth. Based on its forecast, Goldman Sachs does not see meaningful capacity growth until 2025.

Exhibit 15. How U.S. LNG Supply May Grow By 2026 SOURCE: Goldman Sachs
With no prospect of a surge in U.S. LNG export volumes, the challenge for getting more gas to Europe involves redirecting current export volumes, along with the marginal incremental supplies already coming online. This will require the market to drive the shift, as it has done since the fall of 2021 with higher spot gas prices in Europe than in Asia. Shifting contracted cargoes away from buyers will depend on their need for gas supply and the opportunity to earn a profit on the cargo.
The biggest problem for Europe is overcoming its gas storage problem. We are coming to the end of the European winter, so gas storage facilities are low – below 30%. The largest European gas storage facility is in Germany but owned by a subsidiary of a Russian gas company and is reportedly empty. That facility represents 20% of Europe’s gas storage capacity.
To understand the scope of the gas storage problem, BTU Analytics did a modeling exercise based on Europe losing either 50% of its Russian gas supply, or a complete cutoff. The chart below shows (dotted lines) the resulting gas storage forecasts for 2022.The modeling assumed 2022 gas storage injections and withdrawals would mirror those of 2021, there would be no increase in non-Russian gas supplies, and the two assumed Russian gas supply scenarios. As modeled, with 100% cutoff of Russian gas, Europe is out of supply before the end of June. Losing 50% of Russian gas leaves Europe’s storage near zero by late December, highlighting the challenge the continent would face in getting through the balance of the 2022-2023 winter.

Exhibit 16. The Scary Outlook For Europe’s Gas Storage Situation SOURCE: BTU Analytics
BTU Analytics modeled a scenario that would get Europe through the 2022-2023 winter before exhausting its gas supply. The scenario’s details highlight the interconnections of various geographic markets and how countries would need to cooperate to make it work. It also confirms the difficult global gas supply situation that will exist for the next few years. The scenario is based on five U.S. LNG export terminal expansions being competed over the next five years, but with the largest expansion entering service beginning in 2025.
BTU Analytics sees 3.8 bcf/d of additional U.S. LNG coming online by the end of 2025. Very little of this new supply has been contracted specifically to European buyers. While this incremental supply is not off-limits to Europe, it means European gas prices will need to remain elevated for years to secure those cargoes. The modeling shows that all the incremental U.S. LNG produced in 2021 and the volumes projected through 2025 would still only replace 25% of the Russian gas currently flowing into Europe.
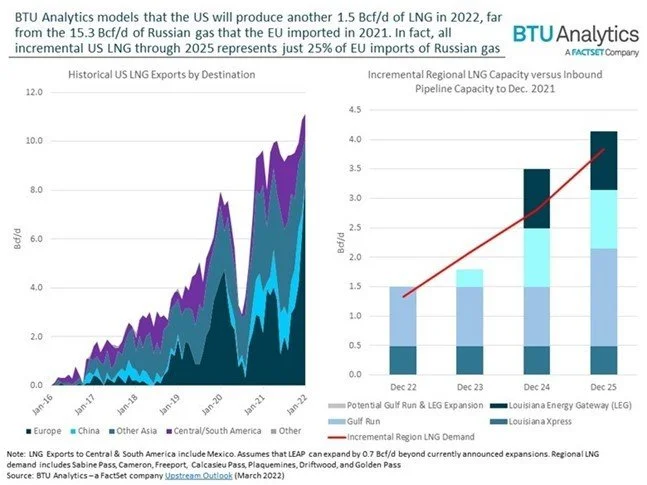
Exhibit 17. U.S. LNG Contribution To A Russian Gas-free Europe SOURCE: BTU Analytics
How else could Europe make up for the loss of Russian gas? The Power of Siberia pipeline between Russia and China, built in 2019, is expected to ramp up to full capacity of 3.68 bcf/d by 2025. Russia and China are discussing building a twin pipeline – Power of Siberia 2 – which would move more gas than the first one. This project is years away, so it will have little impact in the foreseeable future. With the growing output from the first pipeline, BTU Analytics estimates this year there could be roughly 0.9 bcf/d of available supply that could displace LNG that otherwise would have been delivered to China. Coupled with the incremental U.S. LNG supply discussed above, BTU Analytics believes that Europe could get through to the end of 2022 if all Russian gas were cut off. A better outcome is that Europe could make it through to early 2023 before its gas supply is depleted if it only loses 50% of the Russian gas volumes.

Exhibit 18. A More Optimistic European Gas Storage Scenario SOURCE: BTU Analytics
If this is the optimal case, and there are many forecasts for LNG in Europe, then the slog to get the continent through a Russian gas-less future will be long, slow, and likely very costly. Demand response will be important and lowering thermostats will be critical but uncomfortable. A colder than normal winter in Europe would create severe hardship, as the current winter has been more normal. Another challenge would be another year of wind stillness and cloudy skies, crimping renewable energy output and putting more pressure on natural gas-fired backup power supplies. Thus, we see more European countries re-activating coal-fired power plants and securing necessary fuel supplies. Several countries are extending their nuclear power plants that were scheduled to cease operating at the end of this year, although Germany utilities say they cannot extend their remaining operating nuclear plants beyond December 31, 2022.
Reports are that the EU will organize to buy LNG as a group rather than for individual countries to bid against each other for supplies. While this plan is presented as helping to mitigate escalating gas prices, it is difficult to see the EU having sufficient buying power to alter the global LNG market price. The plan is voluntary, so every country participating must be assured it will not be victimized in the process. Already Spain, which has little interconnection with the European gas pipeline grid but has nine LNG import terminals, is concerned about it being victimized by LNG volumes flowing to northern European countries.
Germany recently said it has a plan to reduce its dependency on Russian gas to only 10% of current volumes by the summer of 2024. A key part is the addition of LNG import terminals. While it has approved the construction of its first terminal, two utilities are in the final stages of negotiations to secure the use of three floating LNG regassification terminals that could deliver 27 bcm of gas per year. The question is where will this LNG come from?
Another year of wind stillness and cloudy days, or an early cold winter will present serious challenges to Europe’s gas supply situation. Utilities will increasingly rely on fossil fuels – coal and natural gas – for backup power, not a great option from the continent’s carbon emissions goal. Has this possibility been factored into the thinking about future gas demand? Contrary to the view that getting the extra LNG to Europe will not be difficult, the last 18 months has proven how difficult it is to revamp existing energy supply chains. This process will take longer than politicians and bureaucrats anticipate, and it will be more costly for consumers than they expect.
Offshore Wind Performance Raises Questions About Output
The United Kingdom is a leader is building offshore wind farms to fuel its transition to a decarbonized economy. The offshore push came after the country had built a sizeable onshore wind industry, which it may now try to expand in a controversial strategy to accelerate the energy transition at a time when renewables have underperformed, the decarbonization push has created energy availability fears, and the explosion in natural gas, coal, and crude oil prices is knocking holes in citizens’ budgets.
U.K. energy researcher Paul Homewood recently wrote a blog asking, “How Volatile is Offshore Wind?” He began his blog with the following statement and question:
It is commonly claimed that the wind is much more constant and reliable in the North Sea and around Britain’s coasts than it is inland. “The wind always blows!”
But how true is this?
That is a popular refrain from wind energy proponents. Just as they will tell you that if the wind is not blowing where you are, it will be blowing somewhere. That is their argument for building wind farms all over and tying them into a single grid so the power will always be on.
Homewood secured daily offshore wind output from the Low Carbon Contracts Company (LCCC) that administers the government’s Contracts for Difference (CfD) program, which is its main mechanism for supporting low-carbon electricity generation. Renewable energy generators, who meet the eligibility requirements, can apply for a CfD subsidy by submitting what is a form of “sealed bid” during auctions. Successful developers of renewable energy projects enter a 15-year contract with the LCCC, a private company owned by the U.K.’s Department for Business, Energy & Industrial Strategy (BEIS). The developers are paid a flat (indexed) rate for the electricity they produce, which is the difference between the “strike price” (a price for the electricity reflecting the cost of investing in a particular low carbon technology) and the “reference price” (a measure of the average market price for electricity in the Great Britain market). In other words, the developer is provided a subsidy to cover the difference between his cost to produce the electricity and the market price.
The LCCC maintains daily electricity generation data for all its successful CfD projects. Currently, there are 16 offshore wind farms in the program, representing approximately half of the total operating offshore wind farm generating capacity. To answer his question, Homewood tracked the daily data for these wind farms for January 2022. The data yielded the chart below.

Exhibit 19. January 2022 Daily U.K. Offshore Wind Output Source: Paul Homewood
Homewood concluded that offshore wind is volatile. He found daily production ranging from 8,322 to 84,984 megawatt-hours (MWh). This produced a monthly average of 49,245 MWh. He found 13 days when the output was below 45,000 MWh, or more than 10% below the monthly average. Seven of those days failed to produce as much as 25,000 MWh. The average for those seven days was 17,000 MWh, equivalent to output at 15% of capacity. The worst day saw output fall to only 8,322 MWh, or 7% of capacity. As Homewood pointed out, this analysis was for January, a winter month when wind speed is supposedly better than summer months when low wind speeds are more the norm. The British government has embarked on a program to boost offshore wind capacity to 40 gigawatts (GW) by 2030, but at a 7% minimum output, 3 GW is all that can be confidently counted on.
While the one-month analysis was interesting and important for understanding the consistency of offshore wind output, we wanted to take a longer look at offshore wind’s performance. Our goal was to assess performance over time, see if there were noticeable seasonal differences in performance, and to assess how well the U.K. offshore wind industry is doing. In conducting our analysis, we prepared numerous charts to help guide us.
We start with the list of the 16 offshore wind farms with Cfd’s in operation today. The first one was installed in 2016, but the LCCC operating data only starts in April 2017.

Exhibit 20. The 16 Operating Offshore Wind Farms In CfD Subsidy Programs SOURCE: LCCC, PPHB
As the chart above demonstrates, there has been a steady increase in the amount of offshore wind energy generating capacity installed. These wind farms are spread around the U.K., so they are representative of the entire offshore wind farm fleet. We show how the capacity of this collection of offshore wind farms has grown over time.

Exhibit 21. Growth Of Offshore Wind Capacity Involved In CfD Subsidy Program SOURCE: LCCC, PPHB
Since 2016, this group of offshore wind farms has grown capacity nearly 17-fold. Growth reflects how supportive the U.K. government has been for offshore wind via its CfD subsidy program.

Exhibit 22. How U.K. Offshore Wind Industry Grew And Performed 2017-2022 SOURCE: LCCC, PPHB
The chart above shows the history of the growth of this group of offshore wind farms. We have plotted the monthly MWhs generated (black columns), the theoretical capacity of the wind farms (light blue columns), and the utilization rate (red line). LCCC provided the start date for each wind farm in the program. That enabled us to calculate the monthly theoretical capacity weighted for the number of days new wind farms contributed. We do not know how these farms started up – in stages or all at once? We also have no knowledge of maintenance work on wind farms or accidents that might have taken wind turbines offline.
What can be seen in the chart is the stairstep increases in generating capacity. There has been a steady increase in the wind power generated, although there are monthly output variations. This generating variation leads to higher and lower utilization rates. Despite the wide swings in monthly utilization, they generally have been stable over time. (We will see this later.)

Exhibit 23. The Seasonal Pattern For U.K. Offshore Wind Output SOURCE: LCCC, PPHB
Displaying the monthly history in a different way, we have the chart above. The 2017 monthly data starts with April, while the 2022 data ends in February. Except for July 2017, there is a consistent pattern of higher wind output during winter months (October through February), as opposed to the balance of the year. The July 2017 results were influenced by extremely strong performance by two offshore wind farms, and the fact that their results overwhelmed the rest of the data. We assume the data is correct, as we found later months when these two wind farms produced even more output.
This seasonal pattern is consistent, as wind tends to be stronger during winter months than during summer months, just as we saw with the Block Island, Rhode Island offshore wind farm. What is noteworthy is the 2021 monthly data. As seen in the chart, from June through December 2021, each monthly output was below the prior monthly results. That is important because new wind farms began operation in March, May, and early July. With more capacity, we would have expected more output. The fact that these months did not show increased output confirms the impact of the wind stillness that beset the European continent last year. It was that wind stillness that contributed to renewable energy under-delivering power that forced European and U.K. utilities to scramble for backup power, driving up natural gas and coal prices and in turn, lifting electricity prices.

Exhibit 24. Wind Stillness In 2021 Seen In Year’s Offshore Utilization Rate SOURCE: LCCC, PPHB
Our final chart is based on the data for the four complete years, 2018-2021. What we see is higher annual output but even larger increases in annual capacity. That is dramatically shown by the sharp decline in utilization for 2021, again due to the wind stillness. What this chart shows clearly is the fact that when we rely on renewable energy, installed capacity must be substantially greater than the amount of power output desired. Doesn’t this reality represent a misallocation of national capital? That may have been acceptable when interest rates were low and therefore the cost of capital was cheap. A world with higher interest rates and higher costs of capital for energy projects will mean higher power costs for decades – well above what we are being told.
Homewood demonstrated that offshore wind is just as variable in generating electricity as other renewable energy sources. What we have shown is that the variability in offshore wind output is seasonal. What capacity will be needed to handle an all-electric economy during summer months when electric vehicles dominate the transportation sector? The impact of wind stillness last year is clearly highlighted, which further will exacerbate the need for even greater generating capacity raising the investment requirements. Renewable energy, even considering the more prolific offshore wind, faces challenges for powering a modern economy needing stable electricity.
Random Energy Topics Of Note
Are We Moving More Or Less, And What Does It Mean
Oil prices are being hit by concerns over demand destruction due to high gasoline prices, as well as expectations for more supply hitting the market with the coordinated release of oil from strategic reserves. One oil market sector that has suffered since the pandemic began is jet fuel. Last week there were two articles about business travel. In The New York Times, the article was titled “Business Travel May Not Recover.” It focused on corporate travel spending being permanently impacted by businesses altering working patterns and traveling. Currently, business travel is “a third” of its level before Covid, according to the Global Business Travel Association.
The article pointed out that management consultant McKinsey is the latest company to confirm a permanent cut in its business travel. The firm’s travel will be 25% below pre-pandemic levels due to new travel policies. McKinsey had the ninth-biggest travel budget in corporate America in 2019, according to Business Travel News, spending $265 million on U.S.-booked airfares.
The Wall Street Journal article headline was: “Business Travel Is Making a Comeback.” It reported how travel-related companies are reporting significant increases in business travel. S&P Concur, a travel and expense software provider, reported that in January transactions were up significantly over the prior nine weeks. Likewise, Campbell Travel said 67% of its business in March was related to corporate travel, up from 51% in January. The U.S. Census Bureau, who regularly surveys small businesses on their expectations for business travel spending during the next six months, found that 36.3% of businesses in mid-March were planning spending, up from 33.7% in late December. Importantly, 32% of the businesses surveyed said they had no business travel spending planned.
CapTrav, a company that captures corporate travel bookings, reported that big corporate travel-management companies are averaging around 50% of 2019 booking levels, largely due to the lack of international business travel. The move away from globalization certainly could have a long-term dampening effect on business travel, but even re-shored businesses have global customers who need to be visited and marketed to over time.
Business travel is important for the profitability of airlines, hotels, restaurants, and trade show and large organizational meeting venues.From a jet fuel point of view, the issue is overall passenger travel, as that is what causes planes to fly.The following chart shows daily passenger volume for the first quarters of 2019-2022 passing through TSA airport checkpoints.

Exhibit 25. Airline Passenger Volume Shows Recovery Close To 2019 Levels SOURCE: TSA, PPHB
As the red line for 2022 shows, passenger volumes trailed both 2019 and 2020 in January and February of the respective years. Once the pandemic emerged and economies were shut down, passenger traffic in 2020 collapsed. Now, 2022 passenger traffic is only slightly behind that of 2019. The daily patterns for March mirror each other, with the gap between 2022 and 2019 closing by the end of the month. That is good news for jet fuel and oil demand. Will the balance of 2022 catch and eventually surpass 2019?
What about driving? Michael Tran, commodity strategist for RBC Capital Markets, recently issued a report showing that despite high gasoline prices, driving was not being materially impacted. His previous research had determined that average gasoline pump prices needed to average $5.20 per gallon for demand destruction to occur. We are quite a way from that level with a national average price of $4.21 per gallon for regular gasoline, according to the Energy Information Administration (EIA) as of March 28, 2022.
Tran has worked with RBC’s big data analysts to develop better real-time measures of mobility patterns to gain greater understanding into shifting oil demand indicators. In his article, he commented on the traditional mobility measures energy strategists have used “such as vehicle miles traveled or regional refining margins” to gauge demand destruction. He has been developing two indicators – GOAT (Get Out And Travel) and GOAL (Get Out And Live) – to better track oil demand drivers. Those indices are shown in the chart below.

Exhibit 26. Unconventional Mobility Measures Suggest No Gasoline Demand Destruction SOURCE: RBC Capital Markets
Tran wrote: “As part of our work on our GOAT and GOAL indices, we found that driving direction requests [shown above] are up 15.8% in the US and 9% in Europe over the past month. This means that not only is there increased driving, but also a larger percentage of routes traveled require navigation, meaning that people are traveling beyond their frequently traveled routes.” An interesting perspective on gasoline demand.
To show how big data is impacting energy research and providing insights not previously available, we quote the following from Tran’s report.
Gasoline consumption and the potential for demand destruction is the tip of the economic spear given the combination of multi-decade high inflation prints, record smashing pump prices, and multiple years of pent-up demand for travel given that COVID has approached the long-awaited endemic stage. Given the record surge in gasoline prices, we construct a framework using alternative data to monitor real time decisions made by US consumers and to identify inflection points.
Our big data approach involves leveraging geospatial analytics by locating and drawing boundaries, or areas of interest (AOI), for nearly 135,000 US retail gas stations. We utilized daily geolocation data to monitor foot traffic flow through each individual AOI. We aggregate this data by regional PADD (Petroleum Administration for Defense Districts). The tracked gas stations are distributed in a fashion that is largely representative of the US population.
Further, we superimpose median household income data from the US Census Bureau across each of the gas stations to delineate the corresponding income bracket of which each of the 135,000 gas stations reside. In doing so, we are able to monitor how re-fueling habits evolve across various income brackets. The data is applied to understand the nature of consumer behavior in a rising gasoline price environment, in relative real time. Our findings suggest that rising prices are eliciting an active consumer response, but not in the fashion that most would expect. Spoiler Alert: The change in consumer behavior is not a function of demand destruction.
What Tran found was that gas station visits increased with rising gasoline prices. It appears people spend about the same amount on gasoline fill-ups at each visit, so with rising prices they buy less gasoline necessitating more frequent visits if driving volumes remain constant. So far, there is no sign of this pattern changing. Therefore, we must conclude that current gasoline prices, while substantially higher than earlier this year and certainly from a year ago, and pinching consumer budgets, have had little impact on gasoline consumption, yet.
Joe Biden Dips Into The SPR One More Time
Last week, President Joe Biden announced an “historic” planned release of oil from the Strategic Petroleum Reserve (SPR). This will be his third release in five months, in a battle to tame gasoline pump prices for an unhappy electorate seven months before the mid-term elections. The White House FACT SHEET for this latest planned SPR release described and rationalized the President’s move. It was headlined: "President Biden’s Plan to Respond to Putin’s Price Hike at the Pump.” For the domestic oil and gas industry, however, it was mostly “stick” with little “carrot.”
Biden plans to release, on average, one million barrels per day of crude oil from the SPR for 180 days beginning in May and ending in October. This is the largest release ever and will severely deplete our emergency supplies. Note that the plan ends shortly before the November elections. One hundred and eighty million barrels represents 32% of the SPR’s oil as of March 25th, a reserve intended to protect the economy from fuel disruptions due to war and weather emergencies, not to manipulate high gasoline prices.
The “carrot” offered the industry is that the Department of Energy (DOE) will be restocking the SPR in the future that ensures increased demand for oil producers who ramp up their production. Implicit in this move was an effort to shift oil prices – drive down near-term prices and boost future prices – as a signal to producers to begin drilling and boost future production. The chart below shows how WTI futures contracts were priced on the close of business on March 31 and April 1, after the market had time to digest Biden’s plan. We can see the shift in the futures price curves for those two days, which is documented by the plot of the change in the respective monthly futures contract prices. So far, the strategy would appear to be working. However, one day does not mean much since this strategy does not start for nearly a month and then lasts for six months – a long time for other developments to shape future oil prices.

Exhibit 27. Shifting Oil Price Expectations Worked For One Day SOURCE: CME, PPHB
This plan raises a question. Does the DOE have a lockbox where they are going to put the money until they need it to restock the SPR? As far as we know, revenues going into government coffers get spent and are not saved. What happens if the future price is higher than for what they sold the oil? That happened under Bill Clinton when he sold oil down to $10 a barrel and replaced it at $30? Maybe the government plans not to buy replacement oil. Why do we need strategic oil reserves if we are going all-electric? It would, however, put the SPR at risk of fulfilling its insurance role for the economy, and close to violating our commitment to our allies under the policies of the International Energy Agency (IEA).
SPR oil is handled in two ways. Oil companies may buy the oil, leaving replacement up to the government. Or companies may borrow SPR oil, but are obligated to replace it, thereby relieving the government of the price risk when replacing it, shifting the price risk to the oil company. It is also possible this plan is designed to help the administration balance its budget since the oil sale revenue will offset lost revenues from delayed offshore lease sales and declining royalty income from aging production since the Biden administration has delayed issuing permits allowing new well drilling.
The “stick” for the industry was a half-page in the three and a half-page FACT SHEET devoted to criticizing the oil and gas industry for not doing more to boost output. There was even an attack on Pioneer Natural Resources CEO Scott Sheffield, without naming him, for his comment that even at $200 a barrel oil price his company will not deviate from its growth plan for a 5% production increase. The industry was attacked for “sitting on more than 12 million acres of non-producing Federal land with 9,000 unused but already-approved permits for production.” Of course, lacking permits to build pipelines to move the output and roads to access the sites, the acreage and permit claims are disingenuous.
In addition to the verbal attack on the oil and gas industry, Biden is calling on Congress to make companies pay fees on non-producing wells on leases that have not been used “in years and on acres of public lands that they are hoarding without producing." This language was highlighted in bold in the FACT SHEET to make sure reporters did not miss it. The proposed tax would not impact companies producing from their leased acreage and existing wells but is rather supposed to be a motivator for those oil companies not working their leases to get active. The problem is that this proposal would violate the contract oil companies have with the federal government when they secured a lease. Besides, there are already provisions under the leases for payments for delays and lack of production. Piling on?
Another aspect of the Biden plan is to use the Defense Production Act (DPA) to secure production in this country of critical minerals necessary for clean energy technology – the supposed rationale for its governance. We found this move interesting since it again reflects the administration’s hypocrisy. On the one hand, they are invoking the DPA to get more rare earth minerals supply, but they are aggressively fighting new mines such as the Twin Metals Minnesota LLC copper-nickel mine development near Ely, Minnesota. Its plan is to develop one of the largest copper mines, with nickel and some rare earth minerals, in the U.S. but was fought by the Obama administration, got relief when roadblocks were removed by the Trump administration, and is now fight with the Biden administration. The hurdles the Biden administration wants to put in place may prevent this mine from being developed for 20 years!
It is clear this administration is devoted to its environmental agenda at the expense of the American public, as those are the people who will bear the brunt of the costs from these policies. Moreover, the public will have to deal with any energy shortages that come from draining the SPR for political reasons. This plan is reflective of the poor relations Biden has with key OPEC suppliers who could help us out. All of this is being done to try to win a few votes in November.
Leveraging deep industry knowledge and experience, since its formation in 2003, PPHB has advised on more than 150 transactions exceeding $10 Billion in total value. PPHB advises in mergers & acquisitions, both sell-side and buy-side, raises institutional private equity and debt and offers debt and restructuring advisory services. The firm provides clients with proven investment banking partners, committed to the industry, and committed to success.
