

Energy Musings - April 19, 2022

Energy Musings contains articles and analyses dealing with important issues and developments within the energy industry, including historical perspective, with potentially significant implications for executives planning their companies’ future. While published every two weeks, events and travel may alter that schedule. I welcome your comments and observations. Allen Brooks
Is Wind Energy About To Follow The Route Of Solar?
It seems every country’s emissions reduction plan depends on more wind power. Everybody wants their own supply chain. China is positioned to change that plan like they did with solar.
Germany Reconsiders Its Energy And Foreign Policies
After announcing a 180-degree turn in foreign and energy policies after Russia invaded Ukraine, Germany is having second thoughts because it is finding out the cost of these moves.
Con Ed’s Rate Hike: The Point Of The Inflation Spear?
After shutting the Indian Point nuclear plant and pushing offshore wind, the inflationary impact of these moves is becoming evident. Con Edison is asking for an 11% electricity rate hike for 2023.
The Reality Of The Global Energy Market Of The Future
RFF issued a report that enables comparing 19 scenarios from seven energy outlooks to 2050.
Random Thoughts On Energy Topics Of Interest
March Was Another Good Month For Energy Stocks – What’s Next?
2022 Hurricane Season Likely To Be Above Normal For Storms
Renewable Energy Power Purchase Prices Rising Rapidly
Is Wind Energy About To Follow The Route Of Solar?
Countries around the world are penciling in wind and solar energy in their lineup card of electricity supplies. Whether wind and solar can become the big hitters in the power market lineup is open to question. Both sources are intermittent, which means they only deliver a portion of their nameplate capacity over time, forcing overinvestment in generating capacity to achieve the increased electricity supplies needed to drive the transition to a clean energy world.
New wind installed capacity in 2021 reached 93.6 gigawatts (GW) of power, the second-best year on record and less than 2% below the prior year’s record total. Total global wind capacity reached 837 GW, up 12% year over year. Onshore capacity grew by 72.5 GW, 18% less than in 2020, largely due to the race that year to install capacity in China before the ending of its Feed-in-Tariff subsidy and Covid related supply chain issues in the U.S., the world’s two largest markets. China’s new installed capacity fell 39%, while that of the U.S. was off by 25%. Global offshore wind experienced a boom year with 21.1 GW of new capacity installed, three-times the volume of 2020. It was led by an 80% increase in China driven by its impending tariff termination. Cumulatively, new offshore wind capacity reached 57 GW, equal to 7% of the global wind market.
According to the Global Wind Energy Council (GWEC) Report for 2022, wind capacity growth is expected to continue growing rapidly. Their forecast calls for the global market to grow by 557 GW of new capacity over the next five years, or at a 6.6% compound annual growth rate (CAGR). That equates to approximately 110 GW of new installations each year to 2026. Of that total, onshore wind is expected to have annual installations of 93.3 GW, with the market growing at a 6.1% CAGR. The offshore market is projected to grow much faster – at an 8.3% CAGR – adding more than 90 GW of installed capacity by 2026.
As aggressive as the GWEC projection for wind capacity growth is, the response of European countries to the Ukrainian conflict will likely increase that projection. The war and Europe’s need to reduce its dependence on Russian coal, gas, and oil supplies have led to revised and higher renewable energy goals, as well as efforts to diversify energy supply sources. Increasing wind and solar planned capacity additions marks a common denominator of these plans, including initiating offshore wind developments by some countries.
In Germany, after not installing any new wind capacity offshore in 2021, the government initiated 2022 with a plan to install 20 GW of offshore wind by 2030. In its most recent energy plan, the goal has been increased to 30 GW. The U.K., which has been a leader in wind and offshore wind, had a goal to reach 40 GW of offshore wind capacity by 2030 and 100 GW by 2050. The near-term target has just been lifted to 50 GW with 5 GW of floating wind capacity.
France, Spain, the Netherlands, and Norway have announced new and greater renewable energy goals with wind and offshore wind projected to account for a large share of the incremental growth. The question is rapidly becoming: Can the industry fulfill these goals given the current state of the wind industry’s equipment and installation capabilities? The current supply of critical minerals needed to build the equipment and the upward price spiral those materials are experiencing is raising issues about the economics of renewables in all sectors of clean energy.
While we touched on the wind equipment issue in a prior Energy Musings edition when we looked at the financial results for suppliers for the fourth quarter of 2021, recent WindEurope 2022 conference presentations and interviews further highlight the challenge facing the industry. Sheri Hickok, GE Renewable Energy CEO for onshore wind captured the problem when she stated, “The state of the supply chain is ultimately unhealthy right now.” She elaborated that “It is unhealthy because we have an inflationary market that is beyond what anybody anticipated even last year. Steel is going up three times.” It is not only steel’s cost increases, Hickok said, but also soaring prices for copper, carbon, and logistics. She told the conference attendees that “It is really ridiculous to think how we can sustain a supply chain in a growing industry with these kinds of pressures.” Guess what? Once you have gotten your costs as low and your profit margins as thin as possible, you must raise prices, regardless of the havoc it plays with your customers’ business plans.
A broader perspective of the challenge facing the wind industry was presented by Jürgen Zeschky, the new CEO of Enercon. In his view, “all European onshore OEMs [original equipment manufacturers] are in trouble.” They have arrived at this juncture by responding to “cost was the only driver for developments” during the past eight years. Low levelized costs of energy and low turbine prices are what drove the business. As customers were forced to compete for revenue that was constantly declining because of low levelized cost of energy, they had to secure ever-cheaper equipment, especially turbines. OEMs, in turn, were forced to seek ways to reduce their manufacturing costs. That was largely accomplished by “outsourcing to low-cost countries,” according to Zeschky. Eventually, you run out of low-cost countries to go to, and then the cost increases become devastating.
That view was seconded by José Luis Blanco, CEO of equipment supplier Nordex. He pointed out that even before the Ukraine war, the economics in the wind industry had been destroyed by the low levelized cost of energy that put undue price pressures on developers and OEMs. Blanco told conference attendees, “We are still selling at loss, because of the dynamic of auctions, the low predictability of volumes.” That last dynamic has become critical because of pricing strategies based on expected order flow. As Blanco put it, “We are investing in volumes in trust in market dynamics, then the volume doesn’t come, then a factory is empty, [and then] it is better [to have] some cash flow than no cash flow — and [consequently] the sector enters into a self-destructive loop.”
The “self-destructive loop” was demonstrated by Nordex’s financial results and future guidance. In 2021, Nordex reported a consolidated net loss of €230.2 ($255.3) million compared to a loss of €129.7 ($140.0) million in 2020. The expanded net loss came despite growing sales, production, and installations that were insufficient to offset rising costs and the disruption of global supply chains due to Covid. Nordex had been expecting improved profit margins given strong orders – 7.95 GW in 2021, up from 6 GW in 2020. Blanco commented that the improved margin expectation was premised on the increase in orders that he said were not driven by cutting prices.
This year, Blanco expects Nordex’s earnings before interest, taxes, depreciation, and amortization (EBITDA) margin to be between 1.0% and 3.5%. The EBITDA margin in 2021 had fallen to 1.0% from 2.0% in 2020. EBITDA is a measure of company operating profitability. Operating margins in this range reflect the competitive marketplace Nordex is in and highlights the challenge of boosting profitability. To appreciate the challenge facing executives like Blanco in boosting EBITDA margins, it means selling equipment at prices that more than offset the increase in raw material costs, sustaining labor productivity, and delivering products on time and on budget. This recipe is challenged by raw material costs that are volatile and often outside of control by companies. Overall inflation will drive up wage rates that will make keeping labor productivity high a challenge. Last, the freight market remains upset by Covid disruptions, high shipping rates, and port congestion adding time to delivery and raising costs. It is impossible to forecast when, or if, this trifecta of cost pressures that are largely outside the control of managements will calm down.
The uncertainty about the cost outlook for European wind OEM suppliers opens the door for China. Chinese OEMs unsurprisingly dominate the domestic wind market, the world’s largest. Within the world’s largest wind market, European OEMs have very small market shares – 2%-3% - and find that they are losing share. Domestic Chinese OEMs have the benefit of access to the large supply of raw materials necessary for manufacturing turbines and nacelles, as well as towers, which are made from steel and cement.
According to Philip Totaro, CEO of IntelStar, a renewables market intelligence consultancy, “Rising costs in Europe and the U.S. are not being seen in China, meaning that locally made machines are now almost half the price of Western ones.” Therefore, it is not surprising to also see a headline in Recharge Daily to the effect that Iberdrola is in talks for its “first ever deal” to use Chinese offshore wind turbines.
Iberdrola is a Spanish multi-national utility company engaged in electricity generation and distribution, renewable energy, natural gas production, sale, and distribution, and telecommunications. It is the third largest world utility by market capitalization. The company operates through numerous subsidiaries and partially owned utilities in major regions of the world and is the second largest operator of offshore wind farms.
In describing the talks with Chinese OEMs, the phrase used by Iberdrola was “It’s a global market.” That is true, and the current market dynamics suggest Chinese OEMs are well positioned to begin claiming global market share outside of China, much like it did with the solar panel business some years ago. If they strike a deal with Iberdrola, Chinese offshore wind turbines would soon find homes in European wind farms. Will U.S. locations be next despite the push by the Biden administration for a U.S. wind supply chain?
Totaro educates us about the current market and why it is currently favoring Chinese OEMs. The total cost to produce a wind turbine and tower, which reflects raw material and labor costs, is referred to as the ExWorks cost. That is the cost incurred before the wind turbine parts are shipped from the plant that manufactured them to the project site. ExWorks provides a standardized measurement tool, as it can be estimated in $ per MW, enabling easy comparisons among OEMs around the world.
Recently, onshore wind turbine ExWorks costs for most Western OEMs have been in the range of $650,000-$800,000/MW depending on the region. Totaro says that the sale prices for those turbines have varied between $680,000-$1,200,000/MW over the past few years. Chinese OEMs, on the other hand, due to low labor and raw material costs, as well as availability, have ExWorks costs as low as 2,027-2,618 yuan/MW ($342,328-$411,107/MW), or nearly half the cost of Western OEMs. With such a cost disparity, it is not surprising that Western OEMs have formed joint ventures and established subsidiaries to capitalize on the low Chinese costs.
The Western OEMs are counting on their operation and maintenance (O&M) contracts for wind farms that provide profit margins in the 8%-20% range. Many of these O&M contracts are paid for upfront, so the profit margins can be sustained if there are no early serious warranty or maintenance work required. As the quality of Chinese wind turbines has improved and the designs are competitive, the low cost and greater assurance of access to key raw materials and cheap labor will open opportunities to supply wind turbines to Western companies.
While we envision the Chinese OEMs initially only supplying equipment and Western companies overseeing the installation and O&M work, do not be surprised if those business opportunities are targeted. While Chinese OEMs might have greater difficulty entering the U.S. offshore wind market beyond selling wind turbines, elsewhere we could see them competing to install turbines and even providing O&M services. One only needs to think of how the offshore drilling rig business operates with floating units in foreign waters and crews rotated in and out every 30 days to envision a Chinese wind turbine O&M vessel supporting a labor force providing installation and maintenance services on a rotating schedule.
Our point in highlighting such possibilities is to remind people that just because we think there are competitive barriers it is often not the case when companies in an industry are under financial pressure or forced to look for new growth opportunities. The following is a brief review of what happened in the solar photovoltaic panel market. To some, this is ancient history, but the reality is that it happened within the past two decades, which for businesses and technologies is not a particularly long span, nor that distant.
Solar panels initially were developed by Bell Laboratories in 1954. Market growth was supported primarily by governments through military and space investments and communications technology. They received a boost in the 1970s, when the oil crisis emerged, as solar panels were viewed as an alternative to using oil in certain applications. When global oil prices collapsed in the 1980s, the push for solar also waned.
Energy-short Japan stepped up and pushed the development and use of solar panels during the 1990s and 2000s. In the U.S., the California electricity crisis of 2000-2001 spurred the development of Renewable Portfolio Standards (RPS) for utilities that mandated the increased employment of renewable energy, which helped create demand for solar panels. The use of the Investment Tax Credit for renewable energy became a vehicle to further spur solar growth.
These market drivers helped boost demand for crystalline-silicon (c-Si) cells for panels and was dominated by U.S. companies. This early generation solar grew to over 90% of the global market in the mid-2000s. This technology was the initial entry point for Chinese solar panel manufacturers.
The second-generation solar technology rested on thin film technologies that can be made from various materials but are less efficient in practice than c-SI because they convert a smaller portion of the solar energy falling on them into electricity. The fact they could be produced in more flexible form and thus could be used in a wider range of configurations helped spur their use. The real key, however, was that they were projected to be much cheaper to make in the long-term.
The world’s largest solar panel producer at the time, Japan’s Sharp, invested heavily in amorphous silicon (a-Si), a thin film technology used since 1980 in pocket calculators. Soon, a third generation of solar technology emerged that used organic materials. This technology was thought to be so promising that it was projected to overtake the first two technologies by combining high efficiency and low cost. This did not happen because China emerged as the new solar technology powerhouse and altered the future course of the industry.

Exhibit 1. How Dramatically China’s Solar Market Share Grew SOURCE: ITIF
China was a miniscule factor in the photovoltaic (PV) solar cell industry in the early 2000s. It had less than a 2% market share in 2003 but grew that share to 7% in 2005. The next two years saw quantum jumps in Chinese market share, hitting 14% in 2006 and 29% the following year. Only four years later, China had a 60% market share. With so much power, China’s business strategy reshaped the PV industry by discouraging R&D in new technologies that would be more efficient and possibly cheaper to produce. With sheer scale, China dominated the industry and drove down prices. The impact of this market dominance and strategy can be seen in the following chart showing firms entering and exiting the industry during 1975-2015.
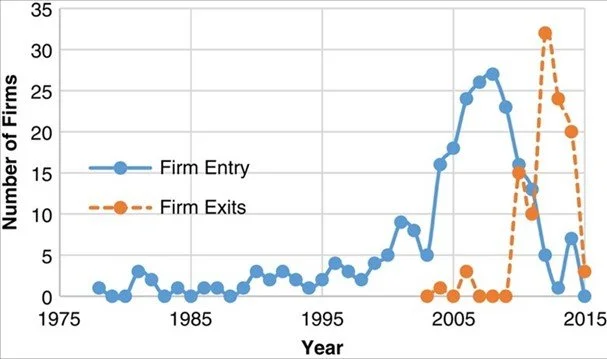
Exhibit 2. The Comings And Goings Of Firms In Solar Industry SOURCE: ITIF
Chinese company dominance in the market has continued and has grown since, as demonstrated in the following chart.

Exhibit 3. China’s Solar Market Share Remains High SOURCE: Bloomberg
The result of Chinese entry into the PV market and rapid dominance, which continues today, has put pressure on the earnings of companies and suppression of new technology developments. The financial implications are shown in the chart below that focuses on the gross and operating margins by quarter for 2010-2020. The most interesting data is the bars showing the 20% and 80% range of the universe of respective margins.

Exhibit 4. Profitability In The Solar Market SOURCE: ITIF
The chart above does not include small “zombie” companies that continued to operate under the direction of governments or others, without regard to profitability. The point made by the authors of the paper containing this chart, which comes from research by the National Renewable Energy Laboratory (NREL), is that the negative financial results in the 2011-2013 period were partially due to the collapse in silicon prices. Market competition contributed to the losses in the 2015-2019 era. The key point of the chart is that the Chinese PV industry is highly dependent on subsidies to sustain their operations in producing solar panels at low and unprofitable prices.
China has identified the clean energy industry as a critical growth sector and an area where the country has competitive advantages that will help its economy grow. China possesses the key raw materials and the processing capacity necessary for clean energy products, along with cheap labor, steel, aluminum, and energy that allows them to be manufactured cheaper than in western economies. China has the potential to be a formidable competitor in the global wind turbine industry. As a tenet of China’s economic strategy, the government is happy to provide subsidies to help anointed companies carve out global market share. Will the global wind industry lead to the energy industry trading dependence on a few oil-producing countries for fuel for an industry dominated by China with potentially questionable goals?
Germany Reconsiders Its Energy And Foreign Policies
On Sunday, February 27, German Chancellor Olaf Scholz spoke at an emergency meeting of the Bundestag. In his speech, which we covered in our March 8 Energy Musings, he announced an immediate commitment of €100 ($115) billion in armaments for the German military, sending military supplies to Ukraine, boosting the government’s annual military spending to 2% of the budget in line with NATO’s requirement, suspending the certification process for the Nord Stream 2 natural gas pipeline connecting Russia to Germany, mandating increased natural gas and coal storage volumes be reached before the onset of winter, extending the lives of coal and nuclear power plants, constructing two new liquefied natural gas (LNG) import terminals that would also be capable of importing hydrogen, and increasing investment in renewable energy. These policy moves represented a 180-degree turn in Germany’s decades-long foreign policy and its more recent green energy push. The emphasis on “security,” both from military and energy points-of-view, became the government’s new guiding principle.
Scholz called the change a “Zeitenwende” – an epochal change. It received significant applause that Sunday. Six weeks later, not only has the applause ended, but the policy shifts are being reassessed and likely walked back. In our opinion, from doing the “right” thing, it appears Germany may revert to doing the “wrong” thing.
As the atrocities emerge from the Russian-Ukrainian war, the desire to inflict more economic pain on Vladimir Putin’s government by banning the importation of Russian oil and gas is growing. Except in Germany where this idea is taking a backseat to the reality that such a ban would create significant financial pain for German citizens, but importantly, it would deliver a devastating blow to Germany’s heavy industries sector, the backbone of its economy, and reducing their global competitiveness. Such a decline would cost German jobs with a worsening economic outcome. Therefore, Scholz has been reluctant to go along with a European Union ban on Russian oil and gas, which powers much of Germany’s economy. He has agreed to support a continent-wide ban on Russian coal, probably because there are other coal suppliers available.
According to the German Association of Coal Importers (VDKi), about half of the country’s hard coal, used for heating, and three-quarters of its steam coal, used to generate electricity, come from Russia.In 2021, Germany paid Russia about €2.2 ($2.4) billion, representing roughly a quarter of what Europe in total purchases from Russia annually. Coal users have said they can replace Russian coal from Australia, South Africa, and Indonesia within a matter of months, although prices will be higher and there is the possibility of logistical hassles. Thus, banning Russian coal is considered the easiest European and German option for energy sanctions.

Exhibit 5. Germany’s Energy Use By Fuel In 2020 SOURCE: Enerdata.net
According to various estimates, Germany imported 35%-40% of its natural gas supplies from Russia, while it also received about 34% of its crude oil supply. In the case of natural gas, Germany’s largest storage facility and the largest one in Europe is owned by a subsidiary of Russia’s Gazprom. Germany has taken over the German subsidiary of Gazprom as part of its sanctions against Russia. The facility is reportedly empty, but where will the gas for injection come from since the facility is hooked up to a Russian-supplied gas pipeline?
The high levels of German energy dependency on Russia, given the lack of alternative suppliers and the infrastructure to efficiently move fuel imports from other countries throughout Germany, is why Scholz is reluctant to join a European Union ban of Russian oil and gas imports. The following chart shows Russia’s role in Germany’s crude oil imports.

Exhibit 6. German Crude Oil Imports By Source In 1,000s Of Tons SOURCE: Reuters
The bigger problem may be that the German people and the key political parties in the country and government coalition are having second thoughts about backing Scholz’s policy shifts. He has already dragged his feet on sending 100 armored vehicles to Ukraine. His reluctance to back a ban on Russian oil and gas is seen as a wavering, but it reflects the reality of the pervasiveness of Russia’s involvement in Germany’s energy business. For example, the PCK Schwedt refinery that supplies fuel to nine of ten cars in Berlin and the surrounding state of Brandenberg is 54% owned and controlled by Russian oil company Rosneft. Furthermore, 50% of the electricity produced at the refinery is sent to the German state grid.
The refinery was built to process Russian Urals crude imported via the Druzhba pipeline. The only other source of supply comes through the Baltic Sea port of Rostock, but it can transport only a fraction of the oil the refinery requires. Alternative crude oil supplies would mean Germany would need to compete in the world market, likely driving fuel costs higher. In addition, Rosneft has minority ownerships in two other German refineries. Western oil companies who hold minority ownership in PCK Schwedt had entered into agreements to sell their interests to Rosneft, but those deals are in limbo given the sanctions against Russia. These refinery issues are magnified by Germany’s high dependence on Russian diesel imports, not easily replaced.

Exhibit 7. Countries Most Dependent On Russian Diesel Imports? SOURCE: Reuters
Observers of the intellectual debate unfolding over the policy shifts in Germany point to them taking time ‒ possibly as long as a generation. Even foreign minister Annalena Baerbock, a representative of the Green party, who initially enthusiastically supported Scholz, recently suggested that Zeitenwende may be more “temporary than fundamental.” That view is reflected in German celebrities who have appealed to the government against rearmament and the “180-degree change in German foreign policy” by mobilizing signers of petitions. Green lawmakers are lobbying to spend only a portion of the €100 billion special fund for the military because of other needs like “human security” and climate change.
The challenge the Germans face was summed up well last week in a tweet by the Germany ambassador to the United States Emily Haber. She wrote:
Going cold turkey on fossil fuels from Russia would cause a massive, instant disruption. You cannot turn modern industrial plants on and off like a light switch. The knock-on effects would be felt beyond Germany, the EU’s economic engine and 4th largest economy in the world.”
If the radical policy shifts proposed by Scholz are neutered due to the financial harm imposed on Germans and the country’s economy because of the resulting costs of such actions, it will be a telling development in the energy transition. Energy security will be compromised in the name of energy inflation. Geopolitical risks and economic risks surrounding energy will gain greater importance in charting the path toward a net zero emissions world.
Con Ed’s Rate Hike: The Point Of The Inflation Spear?
New York’s electricity industry is trading its Indian Point nuclear power plant for thousands of offshore wind turbines. It really was not the industry making the trade, rather it was the state’s former governor Andrew Cuomo who made it happen. Closing Indian Point, covering less than a half square mile site on the Hudson River, had been one of his top objectives since he entered office in January 2011. He accomplished the feat in 2017 with an agreement for the plant’s last operating reactor to close at the end of April 2021.
Unit 2, a 1,028-megawatt (MW) generator, was routinely producing 8,000 gigawatt-hours (GWh) of electricity, mostly for New York City and Westchester County. Replacing this power with the largest solar-thermal power unit (Ivanpah) in the U.S. (Mohave Desert) would have required 10 such plants occupying 140 times the nuclear plant’s footprint. If you chose to replace the power with wind-generated supply, the necessary turbines would have covered a roughly 250 square mile area, the size of New York City, or nearly 40% of the service territory of Con Edison. The wind option was Cuomo’s choice, as part of his clean energy plan for New York State. Unfortunately, the offshore wind farms Cuomo envisioned to power Con Edison’s system are still years away from reality. In the interim, the lost output from Indian Point is being replaced by electricity from natural gas-powered plants, adding to the state’s carbon emissions, since the nuclear plant produced none. Moreover, the replacement power costs more.
Closing Indian Point further hurt New York electricity ratepayers who saw the New York State Energy Research and Development Authority (NYSERDA) use its taxpayer funded subsidy mechanism to secure electricity supplies. In 2021, NYSERDA was paying clean energy suppliers $24.24 per megawatt-hour (MWh). That was on top of the federal Production Tax Credit of $23/MWh, meaning a clean energy supplier was earning $47/MWh in checks from government agencies. In 2018, the New York State Independent System Operator (NYSISO), who manages the power grid in the state, said the average wholesale price for power was $45/MWh.

Exhibit 8. Con Edison’s Electricity And Gas Service Territory SOURCE: callmepower.com
At the time Indian Point Unit 2 was closed, it was 45 years old, with at least another two decades of operating life remaining. Erasing this source of clean energy has contributed to steadily rising and expensive electricity costs in New York State and the Westchester and New York City areas. According to NYSISO, at mid-afternoon on Saturday, April 8, the wholesale power cost for Con Edison’s service territory was $48.96/MWh.
The web site electricrate.com provides electricity customers with cheap rate plans for each power company’s service territory, as well as general electricity cost data. It reported that “New York electricity rates are the ninth highest in the United States and even low average energy usage doesn’t make a New York electricity bill more affordable.” The web site showed the following New York electricity cost data.
New York Energy Market Data
Last updated April 2022
The average New York residential electricity rate was 18.27¢/kWh (52% higher than the national average).
The average New York commercial electricity rate was 13.43¢/kWh (38% higher than the national average).
The average monthly energy expenditure for New Yorkers was $303, which was similar to that of Wisconsin and Nebraska. The following are the estimated typical monthly electricity costs for New York: Electricity cost: $102. Natural-gas cost: $68 per month.
The average daily usage of electricity in New York City is 11, 000 Megawatt-hours. One megawatt is the energy needed to power 100 homes! (1 Megawatt = 1,000 Kilowatt = 1,000,000 Watt)
In August 2021, residents in the New York City metropolitan area paid a total of 22.6 cents per kWh for electricity, 56.9 percent more than the national average of 14.4 cents per kWh. Electricity costs were 52.6 percent higher in the New York region compared to the country last August. Over the previous five years, in August, energy prices for local consumers in the United States were between 41.5 and 56.9 percent higher than average nationwide.
As the data demonstrates, New York and New York City electricity costs are high relative to other states and locations across the country. The website stated that in 2021 every state experienced an application for an electricity rate increase. With promises of this trend continuing, the website was promoting the advantage of finding cheaper electricity plans by using its site. The proposed Con Edison hike would continue that trend, and the magnitude will shock customers who are likely to begin searching for cheaper power. The full amount of the rate hike is unlikely to be realized.

Exhibit 9. Now Closed Indian Point Nuclear Power Plant On Hudson River SOURCE: Suffolk.edu

Exhibit 10. The Planned Replacement For Indian Point Electric Power SOURCE: enengineering.com
While Con Edison did not list the closing of Indian Point as a reason behind its large rate hike request, it is likely only a matter of time before the company’s ratepayers learn the financial impact of the power switch. That development awaits the contracting of the new offshore wind power supply before the full extent of the cost becomes clear. With the offshore wind projects in their infancy, it will be a while before the cost is revealed.
In the cover letter for Con Edison’s 818-page rate hike proposal to the New York State Public Service Commission, it referred to its investments in its Reliable Clean City Projects, which shutters older, more polluting generators in New York City and brings new, renewable power to the service territory. Additionally, it listed the 200 MW of new solar generation that is part of a 1,000 MW project to reduce the bills for low-income customers. It is also continuing to fulfill its plan to add nearly 20,000 new electric vehicle chargers by 2025. Con Edison is also working to encourage switching to heat pumps and away from gas furnaces. These clean energy projects are part of the company’s $4.7 billion capital investment program.
According to Con Edison, the rate increase it is proposing will amount to an 11.2% increase in an average electric customer’s bill. There are three components to a customer’s bill – the cost of the power, the distribution cost, and the taxes on the infrastructure. In calculating the percentage increase, Con Edison estimated that the delivery charge increase will average 17.6%.
In the filing was a table with more specific bill increase estimates. For homeowners in Con Edison’s territory, the hikes may be larger, partly depending on the estimated cost for the power, which reflects the company’s contracted supply and estimated costs for non-contracted power. We cannot square the data in this table with Con Edison’s projections, but figure they are a function of differing averages.
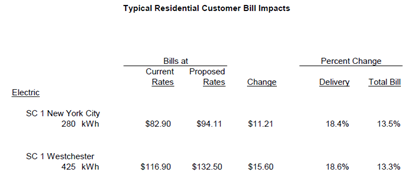
Exhibit 11. Proposed Rate Hike Impact On Customer Monthly Bills SOURCE: Con Edison
Customers will be shocked with the potential increases in their monthly electricity bills. The proposed hike stands in sharp contrast to recent bill increases. A section on Con Edison’s web site explained its rates, how they are impacted by the three factors described earlier and a history of rate increase. We have extracted those customer bill increases comparable to the above categories. Note the difference in customer power use between the proposal and the website.

Exhibit 12. Con Edison Record For Past Rate Hikes On Customer Bills SOURCE: Con Edison
The cumulative monthly bill increases for NYC and Westchester customers were 12.2% and 12.6%, respectively. Those three-year rate increases are less than the proposed 2023 rate increase!
Part of what drives the large rate increase is the cost of property taxes, which Con Edison can only protest. That represents a third of the proposed rate hike. Given inflation and interest rate increases underway, it is impossible to think that property taxes will not continue rising, and likely at an accelerating pace.
Con Edison has also asked for an increase in its allowed rate of return from the 8.5% it is earning now to 10%. It also wants an increase in its debt/equity ratio to 50% from the 48% it is averaging now. Both increases are predicated on the need to generate greater cash flows to protect against higher interest rates for debt service and to preserve its credit rating and work towards a credit rating improvement.
Part of the filing included the testimony from the March hearings where Con Edison’s experts presented testimony on the need for these financial changes. One financial expert directly linked the increase in the return on equity that would come from the 50/50 debt/equity ratio to the company’s cost of capital. The various financial presentations support the idea that Con Edison’s management understands its future financial and operating environment will be different from the most recent past. This necessitates repositioning its balance sheet and earnings potential to reflect a greater clean energy capital investment program, reduced electricity usage (typical residential annual customer use declined 7% between 2013 and 2021), and higher interest and operating expenses. These arguments were reminiscent of those contained in the regulatory rate filing by Nova Scotia Power earlier this year. A new era for utilities is dawning and their customers will be facing higher costs in the future regardless of their being told how cheap clean energy is.
The Reality Of The Global Energy Market Of The Future
Two weeks ago, Resources for the Future (RFF), an independent, nonprofit research institution whose mission is to improve environmental, energy, and natural resource decisions through impartial economic research and policy engagement, released “Global Energy Outlook 2022: Turning Points and Tension in the Energy Transition.” The report is a unique effort to homogenize 19 scenarios from seven energy outlooks published in 2021. The idea is that each outlook has its own assumptions and measures that often make it difficult to easily compare the projections of one to another.
The outlooks and scenarios included are listed below. A quick review shows the diversity of the outlooks and projections, and why comparing such models is such a challenge.

Exhibit 13. The Energy Outlooks And Scenarios Considered In RFF Report SOURCE: RFF
The report grouped the seven outlooks and 19 scenarios into the following four categories:
Reference – assumes limited or no new policies
Evolving Policies – assumes that policies and technologies develop according to recent trends and/or in line with the expert views of the team producing the outlook
Ambitious Climate (2º C) – built around limiting the global mean temperature rise to below 2º C
Ambitious Climate (1.5º) – built around limiting the global mean temperature rise to below 1.5º C
By grouping the scenarios in such a way and applying consistent graphing identifications, it is easier to see how they compare and how they contrast. Below we are showing several key charts from the analysis to demonstrate the messages RFF found. Not only is the report on the RFF website, but there is also the webinar it hosted to introduce the report and its conclusions. For two years, RFF has had on its website an interactive tool enabling one to explore the data from the various scenarios.
The global primary energy mix chart below highlights that only under the Ambitious Climate scenarios do we get to net zero carbon emissions, while also demonstrating the long-term role of fossil fuels.

Exhibit 14. Global Primary Energy Mix and Carbon Dioxide Emissions SOURCE: RFF
The global electricity mix projections reinforce the view that fossil fuels will continue to be important to 2050 in virtually every scenario except the net zero emission ones. It is interesting to note the role of renewable energy sources in these scenarios.

Exhibit 15. Global Electricity Mix SOURCE: RFF
With respect to global oil demand, the range between the high and low projections is 109 million barrels per day, or 10 mmb/d above the 97 used in 2021. RFF suggests these projections reflect a “deep uncertainty over the future of the energy system.” Moreover, it points out the widening gap between climate ambitions and current climate policies.

Exhibit 16. Global Oil Demand SOURCE: RFF
In the case of coal, the spread between the 2050 high and low projections is 167 quadrillion British thermal units (QBtus). That is greater than the 154 QBtus used in 2021. Only one scenario (US EIA) sees demand failing to decline over the forecast period. Under the net zero forecasts coal use goes to almost zero but not totally, which is somewhat surprising.

Exhibit 17. Global Coal Demand SOURCE: RFF
Similarly, the high and low future natural gas demand gap is seen to be 188 trillion cubic feet, some 30% more than the gas used in 2021. All the Ambitious Climate scenarios see lower natural gas demand in 2050 than used in 2021. However, all the Reference and Evolving Policies scenarios project natural gas demand to be considerably higher in 2050 than in 2021. That suggests widely different views of the world’s energy future.

Exhibit 18. Global Natural Gas Demand SOURCE: RFF
All the scenarios see wind and solar demand growing. The Ambitious Climate scenarios envision “unprecedented growth for both sources.” The IEA NZE [Net Zero Emissions] scenario projects adding 602 gigawatts (GW) of solar generating capacity annually from 2030 to 2040. That is roughly equal to the global cumulative capacity of 605 GW installed through 2019. Is that possible? The Reference and Evolving Policies scenarios all see wind and solar output at least 2.5-7.0 times greater than 2020’s amount by 2050 – a challenging outlook.

Exhibit 19. Global Solar and Wind Electricity Generation SOURCE: RFF
These conclusions are only surprising in how they highlight the assumptions behind the various scenarios., but they convey a sense of “all of the above” energy mix futures. Seeing all the forecasts compared as RFF has done makes for interesting perspectives on the role of various fuels at least for the next 30 years. The report confirms that while fossil fuels face a more challenging future, they will play important roles for decades. Yet, even in the Reference scenarios, renewable energy shares grow, so we should be experiencing a cleaner atmosphere in the future. We encourage you to read the RFF report but go to the website (www.rff.org/geo) and play with the data using the tracker software, as it can be very educational.
Random Thoughts On Energy Topics Of Interest
March Was Another Good Month For Energy Stocks – What’s Next?
March proved to be another winning month for the Energy sector of the S&P 500 stock index. While the sector did not wind up atop the sector ranking, coming in second to Utilities, Energy posted a positive 9% monthly performance. The second-place monthly finish came after being the best performing sector during the months of January and February. For the entire first quarter of 2022, Energy posted a 39% gain, way ahead of the rest of the sectors and market overall.
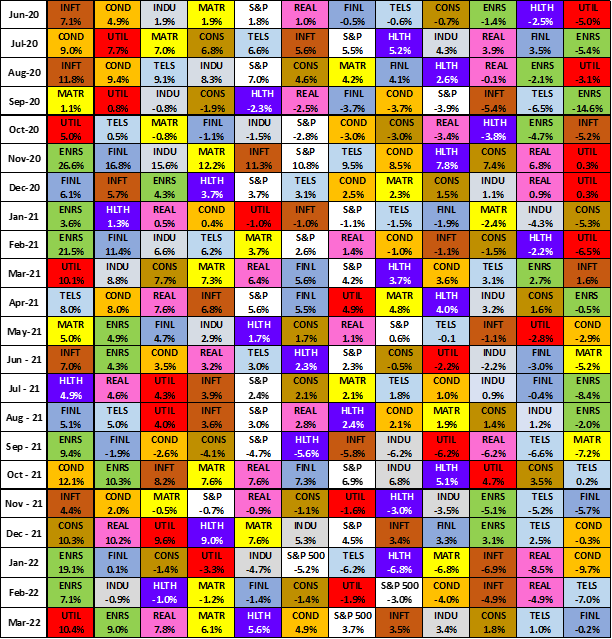
Exhibit 20. S&P 500 Sector Performance June 2020 To March 2022 SOURCE: S&P, PPHB
None of the Energy sector’s performance during the first quarter of 2022 should surprise readers. When crude oil and natural gas prices soared – crude oil up 33.3% and natural gas up 51.3% - during the quarter suggesting rapidly improving profits for oil and gas companies, one should have expected their share prices to reflect this improved outlook. For the entire quarter, Energy led the S&P 500 sectors and with Utilities were the only two sectors to generate positive price performance. The S&P 500 Index posted a 4.6% loss for the quarter magnifying the outstanding performance of Energy.
We were thinking about this market performance as the six oil and gas company CEOs were testifying (being attacked) before the House Energy Committee. Yes, politicians are right to reflect the frustration of their constituents given sharply higher gasoline pump prices due to the rapid increase in global crude oil prices. We expected (naively) some questions about what Congress or the Biden administration could do to help ease the oil market tightness. Instead, we were treated to Congresspersons giving endless speeches rather than questioning the executives, demonstrating a lack of curiosity to learn about the workings of the oil and gas industry and why gasoline prices have climbed so high. That lack of curiosity and interest in learning about the business is why politicians are held in such low regard by the public. In fact, the performance of the Congressional representatives was outright damning. Their amnesia about their past demands of the industry was appalling. Last year, they were attacking these same CEOs about their continued pumping of oil and gas when they should be liquidating their companies for the good of the planet. Now, these companies cannot grow oil supply fast enough to drive down pump prices.
The hearings were comical from the standpoint of watching politicians attack ExxonMobil for having earned a profit of $23.6 billion last year, after having lost $22.4 billion in 2020 when oil prices crashed so hard that they briefly turned negative for the first time in history. But none of the Congresspersons wondered why it was bad for ExxonMobil’s profits to be about a quarter of what Apple earned in 2021. The smaller earner makes it possible for the bigger profit earner to produce its electronic products that make our lives and entertainment more enjoyable. But without the energy and petrochemicals that come from ExxonMobil’s oil and gas operations, our lives would be much closer to those of cave dwellers than what we enjoy in modern times.
The first part of April is not looking pretty for Energy, as oil prices have been pressured by the announcement of the release of one million barrels per day of crude oil from the Strategic Petroleum Reserve (SPR). This move, in hopes of driving gasoline pump prices lower prior to the November mid-term elections, is understood to be a temporary measure. Every indication is that the oil market tightness caused by rapidly climbing demand and challenging supply growth, impacted by the global reaction to Russia’s invasion of Ukraine, is not likely to ease appreciably for several years. Yes, oil prices are giving up most of the war premium in the price of crude oil, but the industry’s underlying fundamentals are not being impaired. High oil prices will continue. This guarantees there will be more Congressional theatrics when politicians call oil and gas company executives to Washington, D.C. to explain once again why they are hurting the public with high gasoline and diesel pump prices.
2022 Hurricane Season Likely To Be Above Normal For Storms
The April forecast for Atlantic Basin tropical storm activity this year was just released by the Department of Atmospheric Science at Colorado State University (CSU). This is the first in the program’s four seasonal forecasts, a project begun by the late Dr. Bill Gray in 1984. Forecasts are released at the beginning of April, June, July, and August, with multiple two-week forecasts produced during the height of the traditional hurricane season. Prior to Dr. Gray’s forecast, none were produced nor were there any efforts made at predicting where tropical storms might travel or make landfall. Everything about tropical storms up until 1984 was “real time” or reactionary.

Exhibit 21. CSU’s First Hurricane Forecast For 2022 SOURCE: CSU
This forecast utilizes a statistical/dynamic hybrid forecast model scheme first used in 2019. The model was developed in concert with the Barcelona Supercomputing Centre and used output from the ECMWF SEAS5 model. It produces the data that is input to CSU’s April forecast model that shows the highest level of skill of any of their statistical models for that time of the year. Their statistical forecast model now uses forecasts from three separate climate model forecasts: ECMWF; the U.K. Met Office; and JMA. These models are used to forecast the individual parameters to forecast Accumulated Cyclone Energy (ACE) for the 2022 season. All the other predicted items, such as the number of named storms, hurricanes, and major hurricanes, are calculated from their historical relationships with ACE.

Exhibit 22. How The CSU Forecast Evolves From the Climate Models Employed SOURCE: CSU
In arriving at its forecast, the CSU researchers not only consider various climate data such as climate patterns like El Niño and Sea Surface Temperatures in the Pacific, Atlantic, and Caribbean waters, but also from analog tropical storm seasons. Those analog seasons are chosen to reflect years with similar climate patterns CSU sees and envisions driving the tropical storm season. Below are the analog years used for this April forecast.

Exhibit 23. Analog Storm Years Are Important In Shaping April Forecast SOURCE: CSU
If we exclude 2021 from the analog storm history, the average of the remaining storm years would have experienced one less named storm, 0.3 more hurricanes, a similar number of major hurricanes, two less ACE, and four less NTC. We also looked up each of the analog years to see which storms were important to the Gulf of Mexico, as this could become a horror scenario for global energy supplies if a serious tropical storm were to damage Gulf of Mexico production and/or its pipeline distribution system, limiting U.S. output. Given the increasing importance of U.S. oil and gas supplies for the global energy market, any event disrupting supplies will reverberate throughout the global energy system and the world’s economy.
While 1996 and 2000 had no storms of note in the Gulf of Mexico, 2001 saw Tropical Storm (TS) Allison traveling along and soaking the Texas and Louisiana coasts and Houston in particular, before heading inland. In 2008, Major Hurricanes Gustav and Ike, along with TS Edouard caused havoc in the region. In 2012, it was Hurricane Isaac that created problems. Last year was very active with Tropical Storms Bill, Fred, and Mindy, along with Hurricane Henri, and Major Hurricane Ida significantly impacting Gulf of Mexico output.
Fortunately, none of these analog years caused devastation of the offshore oil and gas producing industry like Hurricane Ivan in 2004 and 2005’s hurricane trifecta of Dennis, Katrina, and Rita. With precariously balanced global oil and gas markets, Gulf of Mexico devastation such as in 2004 and 2005 could create serious economic harm and human suffering worldwide. Let us hope this scenario does not happen, but given the myriad of unique events this year, we will not rule it out.
Renewable Energy Power Purchase Prices Rising Rapidly
For the first time since LevelTen Energy began reporting in 2018, renewable Power Purchase Agreements (PPA) for both wind and solar energy increased in price in 1Q 2022 for all the Independent System Operators (ISO) who manage electricity grids. The index rose by 9.7% in the quarter. LevelTen Energy characterized the increase as a response to the “pervasive and unabating headwinds renewable energy developers are encountering on nearly every front of project development. Supply chain turmoil and spiking prices for commodities, labor, and project components have added substantial costs and uncertainty for developers as they look to set PPA prices years in advance of project construction.”
Below are graphs of PPA pricing trends. For the quarter, LevelTen Energy examined 298 price offers from 254 renewable electricity projects across the United States. The first graph shows the national average index for each renewable energy source and a blended cost index.

Exhibit 24. Marketed-Average National Index SOURCE: LevelTen Energy
The next two graphs show the price indices for solar and wind energy for transactions within the respective ISOs. The ISOs include California (CASIO), Texas (ERCOT), the Midcontinent region (MISO), the Southwest (SPP), and the Eastern Interconnection system (PJM).

Exhibit 25. Solar P25 Price Indices By ISO SOURCE: LevelTen Energy
Solar developers are confronting supply chain disruptions, interconnection backlogs, rising labor and material costs, and other project inputs that are driving PPA prices higher. According to Gia Clark, Senior Director of Developer Services at LevelTen Energy, “Every aspect of project development has risks to evaluate and balance. However, these days, these risks felt particularly high-stakes. Developers must factor these complexities and uncertainties into PPA offers to safeguard their projects success, as well as their business’ long-term financial security. As long as these myriad headwinds persist, we can expect elevated PPA prices across North America.”

Exhibit 26. Wind P25 Price Indices By ISO SOURCE: LevelTen Energy
The wind energy market is being hurt by congestion-based curtailments. According to LevelTen Energy COO Jason Tunderman, “Transmission constraints during high wind production hours make it harder for wind operators to deliver their project’s output to the grid, which can also put their PTC [production tax credit subsidy] at risk.” The solution will be to build more transmission lines, a growing contentious issue.
It is difficult to see these supply chain, material, labor, and logistics costs reversing anytime soon. As a result, the era of ever-cheaper renewable electricity prices may have come to an end, at least for some time. Since these PPA prices reflect only the marginal cost to generate the intermittent power, these same underlying cost trends will be impacting the balance of the system structures necessary to deliver the power. People should begin preparing for escalating electricity prices, which will also be driven up by the impact of rising interest rates on utility debt and the increased capital investment needed to transition grids to clean energy. We wonder how many people have thought anything about these trends.
Leveraging deep industry knowledge and experience, since its formation in 2003, PPHB has advised on more than 150 transactions exceeding $10 Billion in total value. PPHB advises in mergers & acquisitions, both sell-side and buy-side, raises institutional private equity and debt and offers debt and restructuring advisory services. The firm provides clients with proven investment banking partners, committed to the industry, and committed to success.
