

Energy Musings - March 22, 2022

Energy Musings contains articles and analyses dealing with important issues and developments within the energy industry, including historical perspective, with potentially significant implications for executives planning their companies’ future. While published every two weeks, events and travel may alter that schedule. I welcome your comments and observations. Allen Brooks
The Worry Beads And Changing Times In The Energy Patch
Current focus is on the Russia/Ukraine war and its impact on energy markets. People should focus on more structural changes underway in the world due to higher inflation and interest rates.
Europe Struggles To Determine Its Future Energy Mix
Europe is over a barrel because of its high dependence on Russian gas and coal imports. The EC unveiled a plan to cut dependence, but lacking a cost estimate or a realistic timetable.
1970s Oil Playbook – Deja vu All Over Again!
The idea of a windfall profits tax on oil companies has emerged to help price-shocked Americans. We revisit what happened the last time such a tax was in place. It hurt people and the industry.
Controversial Daylight Savings Time And Saving Energy
Everyone is cheering the possible end to clock switching. The introduction and ending of DST have occurred several times in our history – each time beginning with overwhelming support.
The Worry Beads And Changing Times In The Energy Patch
A month ago, we wrote an article in Energy Musings highlighting the changing environment and outlook for the global economy. Our focus was on inflation and interest rates, as these two forces are often linked and, independently and together, impact current and future economic activity. An aspect of inflation and interest rates that we focused on was the Federal Reserve’s monetary policy, which drives money availability and interest rates, which impact government and corporate policies with respect to spending and investment, and in particular the use of debt to finance growth. Only tangentially did we connect inflation and interest rates with oil prices in our discussion of the policies in the 1970s.
While the world economy is being turned upside down by the war between Russia and Ukraine and the policy responses of western countries, that is not our focus. We are more concerned with the forces that are creating a structurally different economic and political landscape, which will generate economic turbulence and materially alter the world’s economy people are currently anticipating.
Inflation and interest rates are inevitably linked. Interest rates contribute to an economy’s inflation rate by directing capital flows and consumer spending. At the same time, interest rates can be a powerful weapon in fighting high rates of inflation if monetary authorities decide to use them.
As we explore the current economic and social situation, we will be looking back at analogous periods in the past for guidance. This is not to say that we are destined to repeat our history, but rather an acknowledgment that failure to know the history suggests we may be deemed to repeat it. We are sure no one wants to repeat the history of the 1970s, having lived it once.
Inflation and interest rates influence how families, shareholders, corporate managers, and politicians think how to live, invest, and manage, especially with regards to financial management. In our view, the new world we are entering will be a world never experienced by our younger populations. It means they must either look to the past for lessons or be forced to develop management strategies on their own.
The February Consumer Price Index (CPI) data showed that prices rose 7.9% year over year, the highest rate in 40 years. That means going back to the beginning of the 1980s to find such a high CPI rate. It was the product of soaring inflation during the 1970s, driven by exploding energy prices. By the time the nation’s inflation rate was at its peak, a new leader at the Federal Reserve determined that only aggressive use of short-term interest rates would break the price fever. Paul Volker, Fed chairman, guided the federal funds rate from 11.2% in 1979 to 20% in June 1981, which resulted in commercial bank prime lending rates reaching 21.5%. Such a high interest rate helped create the 1980-1982 recession that saw the unemployment rate climb above 10%. The impact of driving short-term interest rates so high was to cut the inflation rate from 13.5% in 1980 to 3.2% in 1983. The medicine worked, but at a high cost.
There is anticipation and concern about how this Federal Reserve will use its monetary tools to fight inflation this time. Short-term interest rates will go higher. While a debate existed over how many rate-hikes the Fed will implement, Chairman Jerome Powell indicated in his comments following the recent Federal Open Market Committee meeting that there will be six additional hikes this year after the 0.25% increase announced last week, getting the rate to 1.9% by year-end. It plans another three hikes in 2023, lifting the Fed funds rate to 2.8%. Will that be sufficient to choke off inflationary activity and expectations? Some Fed officials and economists argue that larger rate hikes, such as 0.50%, for at least some of the hikes, might be more effective in breaking the inflationary cycle sooner. At issue is the economic cost of a more aggressive interest rate hike strategy versus a more modest program. Those advocating larger rate hikes believe the economy needs a greater shock to chill inflationary pressures than those pushing for smaller hikes. Is a sledgehammer better than a rubber mallet for taming inflation? We will likely know that answer by year-end.
The most recent CPI data had the Biden administration highlighting that the large increase was driven by higher energy, food, and shelter prices. Two of these three major contributors are always described as “volatile” and should be ignored when considering what “real” inflation is. That is why government officials and politicians like to focus on the “core” inflation rate, which ignores the energy and food components. Of course, energy and food account for the major share of consumer budgets and are purchased often, thus educating people as to what inflation is doing to their cost of living.
In the February CPI release, the Bureau of Labor Statistics reported that the annual inflation rate absent energy and food was 6.4%. Maybe more telling is to look at the annual rate of increase in the index of commodities less food and energy (12.3%) versus the index of services less energy services (4.4%). The increase of commodities was nearly three-times that for services. In effect, what contributed to inflation in February was people buying things more than them paying for services. Things are impacted not only by the cost of the raw materials used in their manufacture, but also the wages of the workers who make the products, and the cost of transportation to get them to market. Some of this inflation was likely due to the ongoing supply chain disruptions, which hopefully will be ending soon. That date may be pushed out given the disruptions from the Ukraine war and its impact on raw material and food supplies. However, there is another force at work in our goods manufacturing sector, which is the effort to “re-shore” our production in hopes of better controlling supply chain disruptions and the inflationary impact.
February’s monthly inflation rate was 0.8%, up from January’s 0.6% rate. Although the difference in the sequential monthly rates was 0.2%, shifts within the CPI’s composition for those two months resulted in a 0.4% difference in the annual inflation rate - February at 7.9% versus January’s 7.5%. The weighting of Commodities less food and energy versus Services less energy services for the February 2022 index was 21.804 vs. 57.395. That compares with 21.699 vs. 57.583 in January. Although those differences do not seem material, they explain why the monthly results in the overall price index were so different.

Exhibit 1. Monthly CPI Changes Have Varied SOURCE: BLS, PPHB
The chart above shows the monthly increases in the CPI from October 2020 through February 2022. While much has been made about the 7.9% annual rate of inflation last month, reflective of the 0.8% monthly increase, as the chart shows, October 2021 and June 2021 showed higher monthly increases (0.9%) yet lower annual rates of 6.2% and 5.4%, respectively. Thus, we need to be careful about the shifting composition of the CPI and its impact on the monthly results. However, these compositional shifts are also telling in what they signal about future inflation and inflationary expectations. The latter is crucial when we consider the challenge the Fed faces in trying to control and reduce the inflationary pressures within our economy.
Why do we believe the new world will be unlike anything people have experienced in the past four to five decades? Because we have spent that period in a world marked by relatively low geopolitical tensions, low inflation, low interest rates, abundant cheap labor, and accommodating government economic and fiscal policies. These factors contributed to the globalization of world economies, thus dampening inflation. These drivers are changing now, however, they are not changing at the same time or same pace.
While we worry about the current high rate of inflation, the more important question is how will the world react if we tame the current high inflation rate, but it settles at a sustained 4% per year rate, rather than the 2.0%-2.5% rate experienced for the last decade-plus? The history of monthly CPI rates from 2000 through February 2022 is shown below.

Exhibit 2. Monthly CPI Shows Inflation At Levels Not Seen For 20 Years SOURCE: BLS, PPHB
To put the inflation issue into long-term perspective, the chart below shows the annual inflation rate for 1960-2021. Note how high inflation was during the 1970s. It is equally important to note the level of annual inflation during the 1980s-2000s compared to the level during the 2010s. As the chart above showed, we are now experiencing an inflation rate substantially greater than any time since 2000. Even in the months immediately preceding the 2008 financial crisis and the subsequent 2009 recession, when crude oil prices were charging toward $150 per barrel, the monthly CPI rate was still less than 6%. If we look further backwards, we see that a 4% rate was only experienced a handful of months during the prior seven months.

Exhibit 3. How Inflation Went From High In 1970s To Low In 2010s SOURCE: BLS, St Louis Federal Reserve, PPHB
The structural tightness in the global oil market, a function of reduced capital investment in the industry since the 2014 oil price collapse, the supply chain disruptions caused by the pandemic, and now the rapid economic recovery as world economies reopen, means we have a limited amount of spare oil productive capacity available to absorb the sharp demand increase. Throughout the past 50 years, whenever global spare oil productive capacity has been marginal compared to the level of global oil consumption, oil prices rose. The following chart shows the annual estimated global surplus oil supply from 1970 to the level estimated for January 2003. As the oil price line demonstrates, when surplus capacity shrinks or is very low, oil prices respond.
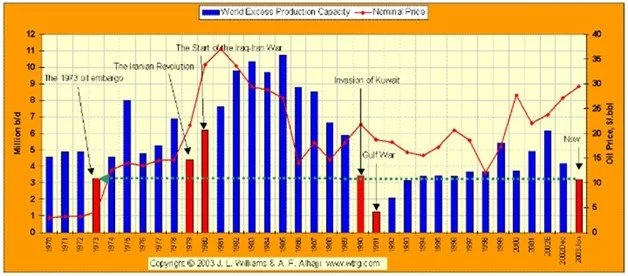
Exhibit 4. History Shows Tight Global Oil Supply Produces Higher Oil Price SOURCE: WTRG Economics
The Energy Information Administration (EIA) shows a similar capacity and price relationship for 2004-2023, with the data since late 2021 representing the agency’s forecast. What the EIA projects is a surplus of about 3 million barrels per day (mmb/d) in the first part of 2022, but then increasing to 3.5 mmb/d by 2022Q4 and then inching slightly higher in the first three quarters of 2023. There are other forecasts suggesting the surplus could be as high as 4.5 mmb/d or as small as 2 mmb/d. These surplus estimates are guesses by energy forecasters, but the key is that they relate to a global oil market that consumes approximately 100 mmb/d. Therefore, the amount of surplus production is under 5% of global demand, not a large cushion against geopolitical and operational interruptions in daily world output.

Exhibit 5. Low OPEC Spare Capacity Tends To Elevate Crude Oil Prices SOURCE: EIA
Such a tight oil market will keep prices elevated. Will they climb to $150 a barrel or higher, or will they slide closer to $90 (current longer-term futures prices)? It did not take long to get that answer. When rumours of a possible peace deal for the Russia/Ukraine war emerged, oil prices crashed by 20% in a couple of days, taking WTI and Brent prices below $100 per barrel. For consumers, cheaper oil will provide welcomed relief, as soon as those lower prices work their way to the gasoline pump. That won’t stop Congress from calling in oil company CEOs to attack them over “price gouging,” without any proof. Still, future oil supplies and demand will dictate prices, with the outcome of the Russia/Ukraine conflict an influencing factor. Extending current western government sanctions against Russia over the invasion will make it more difficult for its oil to be sold, thereby potentially tightening the market for an indefinite period. However, Russia will find buyers for its oil if the price is discounted sufficiently to allow governments to ignore the rath of other countries for buying it. At least three million barrels of heavily discounted Russian oil has recently been bought by refiners in India.
While geopolitical events seem to dominate the global oil market, another powerful force is at work that will limit future supply growth. The demand by shareholders of oil and gas companies that managements limit their reinvestment in the business and use a meaningful portion of company cash flows to reduce debt and reward shareholders, is intended to dampen the traditional boom-bust nature of the business. The corallory to greater financial discipline is likely to be slower oil and gas production growth, which will help sustain high prices. This issue may present less of a problem longer-term for the industry and economies in general, as the transition to alternative energy supplies erodes the market share for oil and gas.
The geopolitical tensions from the Russia/Ukraine situation have countries re-evaluating their energy suppliers and shifting accordingly. Coupled with the poor performance of renewable energy in Europe last year, there is a premium being assigned to oil and gas prices for security of supply. Although that premium can expand and contract daily on the basis of news about geopolitical developments, the reality is that a premium always exists.
A major change underway is countries reassessing their commitment to renewable energy, as the intermittency issue demonstrated a weakness in depending on them to power economies. Even as high oil and gas prices dampen demand, transitioning to renewables will take longer and be more costly than previously thought. Oil and gas will be important for several more decades.
What this outlook suggests is that inflation will be higher in the future than in the recent past, as oil and gas prices remain elevated compared to past levels. That is because petroleum energy plays an outsized role in economic activity beyond transportation fuels. Demand for natural gas will also grow, as Europe decides to wean itself from Russian gas supplies. Like oil, Russian liquefied natural gas (LNG) will find a home at heavily discounted prices. What may not find a market long-term is some of the Russian gas flowing by pipelines to Europe. It is effectively landlocked until Russia develops greater LNG exporting capacity, or entices European buyers at depressed prices.
Expanding the global LNG trade will require time. More export and import terminals along with LNG ships will need to be built, suggesting we are 3-5 years away from meaningful capacity additions. Increased gas supply will also need time. Thus, we can look forward to higher natural gas prices worldwide, but importantly in the U.S., as our expanded LNG trade pushes up domestic prices. Henry Hub natural gas prices in the $4-$5 per thousand cubic feet (Mcf) will be double what gas prices were for the past decade-plus. That higher cost will be imbedded in our economy both in direct fuel consumption and increased feedstock costs for petrolchemicals and fertilizers. In other words, it is going to be difficult to avoid higher raw material costs in our economy, as well as higher transportation costs, and electricity costs.
The past year saw European and Asian LNG prices soar as demand exploded and buyers were aggressively competing for the limited number of LNG cargos available on the spot market. If new LNG buyers are willing to sign long-term contracts to support export capacity growth, future prices may be lower than current spot gas prices. However, these costs will still be higher than the costs countries experienced in the 2010s, and there will be the investment expense in building the necessary infrastructure to foster this growth.
Higher economic input costs will drive up wages, as workers demand their incomes grow commensurately with inflation, if not faster. Compounding the labor cost issue is the demographic changes underway not just in the developed economies, but in key low-cost wage economies such as China, India, Mexico, and Vietnam. Coupled with the reshoring of supply chains, underlying business costs will be higher in the future, after the decades of globalization contributing to lower input costs. Add to those costs the impact of transitioning the U.S. economy, as well as others, to clean energy. No one knows what this cost will be, but there are many estimates. They range from 0.25% per year of global gross domestic product, or $2.0 trillion a year, to as much as $9.2 trillion. We have little confidence in this range of estimates, but recognize that most early estimates for economic issues prove low. We are sure a serious commitment to decarbonizing the world’s economies will burden them with huge costs for the foreseeable future until a new source of low-cost, clean energy reduces the expense.
To keep inflation in check, interest rates will be held at a higher rate than they were during the past decade or so. A higher interest rate structure will have adverse implications for financial markets. The chart below shows the long-term U.S. government bond yield – the 10-year Treasury bond. The chart shows how this yield started in 1960 at about 4.5% but began rising in 1966 and peaked in 1970 at over 7.5%. After dropping as a result of the recession, the rate began climbing again and peaked in 1980 (12.5%) before surging to an even higher peak (15.0%) in 1981 as the 1980 recession developed. During the balance of the 1980s, the yield fell reaching about 8% in 1990, although there were brief periods of sharp reversals during the decades-long decline. The real message from this chart is that since the all-time peak in 1981, long-term yields steadily declined until they reached an all-time low during the global economic shutdown in spring 2020. Since then the yield has been rising. As the Fed moves to bring up short-term rates to tame the current inflation, we expect the 10-year bond rate to rise further.

Exhibit 6. The Modern History Of Long-term Interest Rates SOURCE: Federal Reserve Bank of St. Louis
Another interesting aspect of interest rates is the spread between the 10-year Treasury bond yield and the rate for Fed funds. As the chart below shows, the spread has occilated over time from around zero to a peak of about 4%. There have been some sharp declines in the spread when short term rates spiked above long-term yields (an inverted yield curve), such as in the 1970s and early 1980s, when the Federal Reserve was more aggressively manipulating short-term interest rates to moderate inflationary pressures within the economy. Note that almost every time the bottom in the yield-spread occurred was immediately before a recession (shaded gray bars), with the exception of 1986 and 1998. We can’t identify a reason for 1986. The 1998 spike may have been associated with the Asian currency crisis that required moves to protect the U.S. dollar and help offset a potential recession. The most recent months reflect a rising ratio since the pandemic low and brief 2020 recession.

Exhibit 7. Spread Between Long-term And Short-term Interest Rates SOURCE: Federal Reserve Bank of St. Louis
We expect the ratio to begin declining as the Fed raises the Fed Funds rate, unless lender inflationary concerns drive up long-term rates. The current problem, according to economist Mickey Levy, is that “the fed funds rate is further below inflation than in any period in history…” This suggests the fed funds rate needs to be raised substantially to curb inflation – will 2.8% be enough? In fact, in the past, to curb inflation, short-term rates needed to be higher than the inflation rate. It is hard to imagine the Fed pushing the rates to 8% to curb the current inflation.
What is more important is that long-term rates are already rising, which should be a warning to corporate America about what will happen to their cost of capital. Higher interest rates and higher inflation also impact governments. Rising borrowing costs, higher worker salaries, and a rising cost from unfunded liabilities, mainly pension benefits to retired workers, will command greater shares of government budgets, necessitating curbs on spending or tax increases. Depending on the choice made, family budgets and corporate incomes will suffer.
We highlighted in our month-ago article the role that growing debt burdens have had on debt/GDP ratios and the likelihood that these high ratios will not be tolerated by purchasers of U.S. government debt. Higher coupons for our debt will increase the interest expense for the U.S. government and squeeze its spending, just as geopolitical tensions are mandating increased military spending, and the social costs in the budget are pressured by higher inflation. The federal government will soon be facing a spending curb or tax increase decision, unless it counts on the Federal Reserve to continue funding endless budget deficits. Inflating the money supply will dilute the value of the U.S. dollar in global trade, a concern we are beginning to see emerge in the rumours of Saudi Arabia selling its oil to China in yuan rather than dollars.
Higher borrowing costs and a higher cost of capital for corporations will put their profits under pressure, further reducing government tax revenues. A viscious financial cycle is beginning. It is part of the great reset underway that has profound implications for governments, corporations, and individuals.
The great reset will also be impacted by events playing out on the world stage. While the Russia/Ukraine war is the current flashpoint for foreign policy, the West’s tensions with China over its desire to control Taiwan, and the goal of the Mullahs in Iran to erase Israel from the Middle East map add to the drama. The inroads of China and Russia in Africa and South America is also reshaping the political map. All of these moves have ideological undertones and are challenges to American and democratic values and our way of life. How will the federal government respond? What will the cost be? How fast will the changes come?
The significance of this new future was outlined by Julien Garran of The MacroStrategy Partnership in a recent article. He dubs the new global line-up of geopolitical foes to the U.S. “Axis” countries that are aligned with Russia. They include China, Iran, the ‘Stans,’ Syria, and Venezuela. Garran writes the following about his vision of U.S. policy response.
First, restrictions on trade, and the transfer of capital, not just with Axis countries, but also based on climate change policies and other ‘ethical’ considerations. Second; investment in energy security and incentives for onshoring. Third; military expansion and fiscal support for lower income families struggling with inflation. Fourth, possibly easier monetary policy than otherwise as the inflation is ‘caused by Russia, China’ etc. All are reflationary and inflationary.
At the corporate level, Garran believes the new business world envisioned by these policy responses will lead to a reversal of the Dupont framework, a tool devised by the company’s management to help investors understand how the company generates its return on equity (ROE), or how well they were doing in managing the shareholders’ investment. The Dupont framework decomposes a company’s ROE into three dimensions - profitability, efficiency, and leverage. The graphic below explains how those three dimensions are managed.

Exhibit 8. How The Corporate World May Adjust To The New Financial World SOURCE: The MacroStrategy Partnership
Garran explained the chart and how managers executed.
On the left of the chart, firms shifted to just-in-time inventory management or operated as platform companies (outsourcing production etc) to lower inventory, to lower physical capital requirements and to raise asset turns, boosting RoE and EPS. In the middle, firms relocated, outsourced or de-unionised to lower wage costs and raise profit margins. On the right, firms took advantage of falling yields and tightening spreads to gear up and buy back equity, raising debt-to-equity ratios and boosting RoE and EPS again.
He went on to explain that “in a new inflationary era set against the backdrop of a fracturing world order, firms will be highly incentivized to do a ‘reverse Dupont ferret.’” [Ferret is a British media phrase for a sudden reversal in an organization’s editorial or political line on a certain issue. Garran is British.]
Firms will be incentivised to hold just-in-case inventory, to localise production and to vertically integrate in order to prevent disruption. This will lower asset turns, RoE and EPS.
Firms will outsource and relocate less and produce more at home. This will lower profit margins and raise domestic labour force demand and domestic capacity utilisation. It will also raise the labor share of returns to capital & labor.
Firms will be incentivised to run for cash, rather than borrow to buy back shares. This will lower the debt-to-equity ratio, RoE and EPS.
Garran further pointed out that “In inflations, it is not just rising nominal discount rates that trigger equity derating, it is the change in corporate incentives and behaviour that diminishes the prospect for EPS growth as well.” He points to the impact of inflation, and the policies necessary for dealing with its corrosive effects, on the valuation of equities. As the chart below shows, using the cyclically adjusted P/E ratio for the S&P 500 created by Professor Robert Schiller of Yale University, the inflation of the 1970s led to sharply lower equity valuations. In Garran’s view, there is a chance this history will be repeated, as we deal with the inflation currently imbedded in our economy.

Exhibit 9. Higher Inflation And Interest Rates Depress Valuations As History Has Shown SOURCE: The MacroStrategy Partnership
The new world emerging from the decades of low growth, low inflation, and low interest rates, will be marked by great challenges, as we confront an economy marked by a higher level of inflation and interest rates. It will likely also have a less richly valued equities market, and a debt market demanding higher returns reflected in higher interest rates. Despite the current media and political dialogue, we did not get to this point with the flip of a switch. In fact, many people fail to appreciate the changes underway, because they happen gradually and are less shocking in their initial impacts. Likewise, we will not overcome these forces by flipping the switch back. We are on the road to a less clearly defined future, but one that will demand new policies and behaviors. How they evolve, and how quickly they evolve is unknown. Although we are always challenged to explain the significance of today’s events on tomorrow’s world, we need to step back and look at the broader view and emerging trends and think about how they may impact our future further in the future. A year from now, and certainly 3-5 years from now, we will be in a different world – a world few are thinking about and how to manage it.
Europe Struggles To Determine Its Future Energy Mix
Two weeks ago, the European Commission (EC) put forward a plan to cut its reliance on Russian natural gas supplies by two-thirds in the near-term and by 100% by 2030. The target is to be able to make this cut by 2023. On paper the task looks feasible. But there are many key components of the plan that must come together in a timely manner, which is not assured given the magnitude of the changes and the technical challenges necessary. Moreover, there is no cost estimate associated with this plan, probably because the EC doesn’t know. We believe the EC expects its member governments to spare no expense in insulating themselves and their citizens from being held hostage by Russia’s Vladimir Putin and the threat of Russian energy supplies to EC members being stopped.
The EC press release announcing the plan laid out the basic details under the heading: “REPowerEU – eliminating our dependence on Russian gas before 2030.” The plan is based on two pillars – diversifying gas supplies and reducing the use of fossil fuels. Diversifying gas supplies involves greater LNG and pipeline imports from non-Russian suppliers. It also includes greater volumes of biomethane and renewable hydrogen. Reducing the use of fossil fuels involves boosting energy efficiency in homes and buildings, as well as increasing renewable energy and electrification, while also addressing infrastructure bottlenecks.
While all these steps are feasible, the devil is in the details. And those details involve the cost of the steps. For example, where is the extra LNG to come from? Forecasts are for a small increase in LNG volumes from the U.S. this year, as several export expansions are completed, but these will be small increments to global supply with little to no additional capacity expected until after 2024. The near-term year-over-year supply increases will come from full-year outputs from terminals that started up last year, as well as two new terminals that will come on at different times this year. Worldwide, some of the LNG supply growth is tied to long-term contracts, so competition for spot cargos will remain intense, meaning the price of LNG will remain elevated.
Germany is the most challenged EC member given its high dependence on Russian natural gas. It has no LNG receiving terminals, although it recently approved construction of its first two. Although building LNG receiving terminals is less complex and costly than constructing an export terminal, the time needed will depend on the status of the terminal’s site, the availability of the necessary components, and the efficiency of the construction crew. Instead of the 3-4 years needed for an export terminal, we would expect a receiving terminal will need half that time. This means the new terminals will only be able to help Germany import LNG in the second half of 2023 at the earliest.
Another issue for the EC is that its LNG terminals are scattered among member countries, principally Spain, France, and Italy. The locations are shown in the map below. The numbers within each terminal and storage marker shows the annual volume of gas, measured in billions of cubic meters (bcm). For example, of the seven terminals in Spain, three have double-digit capacities, while the remainder have only single digit capacities. Additionally, given the geographical spread of the terminals, as LNG volumes grow, the gas still needs to be moved through pipelines to final consumers. This may require pipeline operational changes and potentially having to build additional pipelines and connections. This will take time.
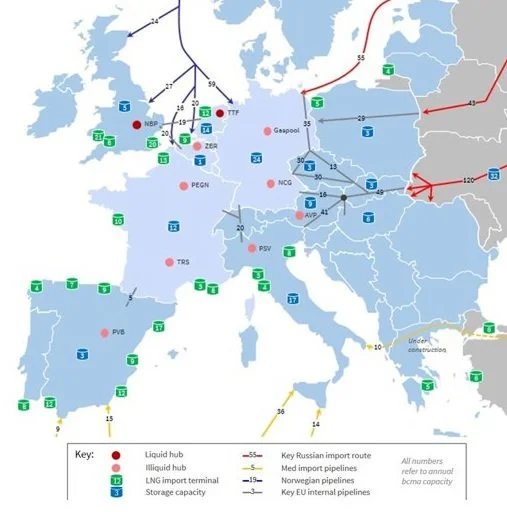
Exhibit 10. LNG Terminals, Gas Storage, And Major Gas Pipelines In Europe SOURCE: Timera
According to the International Energy Agency (IEA), the EC imported 155 bcm of natural gas from Russia last year. The EC’s plan would cut that volume to 55 bcm. The 100 bcm of gas necessary to displace Russian supplies would have to come from various sources as shown in the chart below assembled by the Wall Street Journal. About 10 bcm would come from increased supplies from existing pipelines from Norway, Algeria, and Azerbaijan. Increased LNG shipments will bring in 50 bcm. Biomethane gas will provide 3.5 bcm of new supply, while new renewables in 2022 will offset 24 bcm, and improved efficiency (lower thermostats, increased building efficiency, etc.) will eliminate another 14 bcm.
The chart also shows that if European countries opted to switch generating electricity from natural gas to coal-fired plants, another 40 bcm of Russian gas supply could be eliminated. This option is not likely, at least among the larger and more green-oriented countries, as the preliminary data shows that EC carbon emissions jumped by nearly 5% last year and are projected to rise further this year. The recent statement by Germany that it will stockpile coal and keep plants operating further makes such an EC policy switch unlikely.
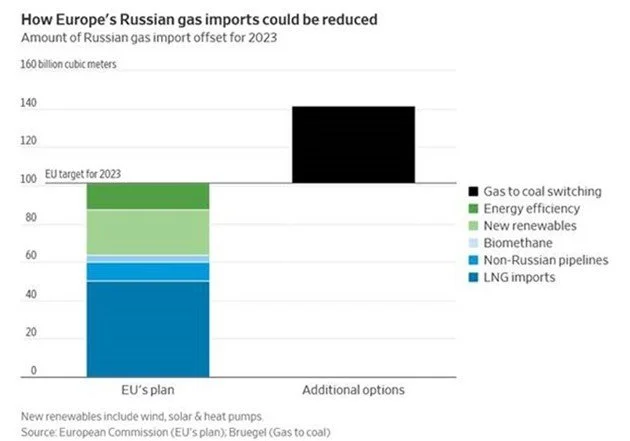
Exhibit 11. European Commission’s Plan To Cut Russian Energy Dependency SOURCE: Wall Street Journal
While this plan, on its face, demonstrates a path to cutting Russian gas to the EC by two-thirds, the reality is that it will be almost impossible to achieve on the timetable proposed. There are less than 10 months left for the industry to be ready to cut Russian gas in 2023. The timeframe is even shorter when one considers that the EC is implementing a plan that mandates member countries have their gas storage facilities filled to 90% of capacity by October 1, less than seven months away.
An additional hurdle for the EC in reaching its goal is that much of current LNG output goes to Asia and is priced on formulas linked to global oil prices. Even with oil prices above $100 per barrel, LNG prices linked to oil remain cheap. Why would Asian customers give up that supply unless they absolutely did not need the gas? Could that happen? Possibly, but it will depend on country energy needs dictated by the level of economic activity and weather. It may also depend on alternate energy supplies making the LNG expensive surplus energy. Unfortunately, EC buyers will be competing for LNG supplies that ensures prices remain high.
Two other considerations for the EC plan are incremental global LNG supply and what happens to Russia’s LNG supply. The table below from a recent Bloomberg NEF report shows 2019 and 2020 LNG supply by country, as well as forecasts for their 2021 (not final yet) and 2022 volumes. Russia shipped 30 million tons (mtpa) in 2020 and supposedly in 2021, and it is projected to ship 31 mtpa this year. Russia supply represents 7.7% of 2022’s estimated world LNG supply. Japan has said it will continue to use Russian LNG coming from its Arctic projects, as Japanese financial institutions have interests in those projects. Will financial sanctions against Russia impact its LNG shipments? We would guess there will be buyers who will absorb the political criticism and abuse for buying heavily discounted cargos. Finding those buyers may prove difficult until the war is ended, which will create turmoil in the market and support high prices.

Exhibit 12. LNG Export Volumes By Country 2019 – 2022E SOURCE: Bloomberg
There are forecasts that some consumers, such as Brazil, are experiencing improved weather this year that will reduce their LNG needs for power generation, freeing up some supply for the EC. On the other hand, several West African countries are beginning to import LNG, representing new customers. Estimates of the volumes involved in these market developments are uncertain, and subject to change as the year unfolds.
The largest incremental supply in 2022 will come from U.S. LNG exporters, representing over half the projected world supply increase. Some of that new volume is committed under long-term contracts with Asian (Chinese) buyers. As a result, the EC will be competing in the world market for LNG cargos to fulfill its plan, unless member countries are prepared to enter 15-20-year contracts to justify new export terminals. This means continued high energy costs for the European continent for the foreseeable future.
Can the EC secure the 40% of displaced gas supply from renewables and efficiency? The idea that gas consumers are going to willingly turn down their thermostats by 2º C (3.6º F) to save on heating bills is more likely going to reflect winter temperatures and the cost of gas. Many families will be looking to their governments for financial relief in the form of increased subsidies or reduced energy charges. The cost of living in Europe is headed up and the number of people living in energy poverty is going to increase. These are trends that will create political tensions and force economic adjustments.
Italy’s Ecological Transition Minister Roberto Cingolani recently told his Senate that it will take at least three years for the country to completely replace its gas imports from Russia with other sources. Rome imports 30 bcm from Russia, about 40% of its total gas imports. Cingolani said 20 bcm could be replaced in the “near to medium term” by raising imports from Algeria by 9 bcm and increasing coal- and oil-fired power generation, replacing another 3-4 bcm of gas. Environmentalists will not like the latter option. Italy would also need to increase power imports from northern Europe and boost LNG imports by 6 bcm.
Cingolani indicated that Italy’s complex permitting process has virtually stopped development of new LNG facilities, which now account for about 20% of daily imports. The two onshore terminals already permitted, with 20 bcm of capacity, would take 3-4 years to build. Floating LNG terminals could be installed in 12-18 months after receiving permits, which could ramp up to 16-24 bcm. Other long-term measures would include doubling the capacity on the TAP pipeline carrying Azeri gas and building 8 gigawatts per year of new renewable power, while also doubling domestic gas production.
This is an honest assessment of the challenge Italy faces in extracting itself from the Russian gas supply system. But it also highlights the complexity of what will need to be done and the challenges of making all the pieces fit together. As one would expect, Cingolani did not offer a cost estimate for this potential plan. It will not be cheap, we are sure. We suspect a cost estimate will not be forthcoming until the Italian government offers a direction it wants to go. Therein lies a major problem with the EC plan – it is optimistic about what is needed and appears feasible. However, without a cost associated, and a more realistic timetable, citizens of the EC face an uncertain energy future. They can look forward to high energy bills for years, and the potential that their power supplies will become a weapon in the geopolitical struggles underway.
1970s Oil Playbook – Deja vu All Over Again!
It happened. No, not $100 a barrel oil. We are talking about politicians reaching back into the 1970s energy playbook in response to $5 a gallon gasoline and heating oil prices. That reach reflects their desperation given the upcoming elections. Moreover, they believe the Ukraine-Russian invasion has given them political cover to wage war on oil and gas companies for the high fuel prices we are experiencing, while obscuring the contribution their party’s anti-fossil fuel agenda has made to these high prices.
In the last issue of Energy Musings, we warned about the language of the 1970s, as it pertained to energy and oil, coming back into vogue. We figured if it happened, we would be forced to dust off the history books in our library. Well, it happened, and we are dusting. If history is any guide, you ain’t seen nothing yet!
A recent article at thenation.com titled “Price-Gouging Oil Companies Need to Pay a Windfall Tax” previewed what would happen the following day. Senator Sheldon Whitehouse (D-RI) introduced The Big Oil Windfall Profits Tax Act, which was co-sponsored by 11 other Democrat senators, to “curb profiteering” by returning a share of the profits associated with high crude oil prices to working families. Similar legislation was introduced in the House of Representatives by Congressperson Ro Khanna (D-CA).
The Whitehouse bill was backed by the traditional cast of anti-fossil fuel supporters from the Democrat party in the Senate. The group included: Senators Jeff Merkley (D-OR), Elizabeth Warren (D-MA), Bernie Sanders (I-VT), Richard Blumenthal (D-CT), Tammy Baldwin (D-WI), Sherrod Brown (D-OH), Jack Reed (D-RI), Ed Markey (D-MA), Cory Booker (D-NJ), Michael Bennet (D-CO), and Bob Casey (D-PA). Not only are all these senators onboard with the “green new deal” and in opposition to the use of fossil fuel, but they represent areas of the nation that use heating oil extensively along with gasoline, and those areas support their senators’ views.
At the time the legislation was introduced, an organized effort was launched to make the case in the media for the righteousness of this move. Remember, one of the tenets of this anti-fossil fuel movement is to promote the idea of the guilt of the oil and gas companies. You are “guilty until you prove your innocence,” and in today’s world that is almost impossible. Demonstrating this view is the following tweet by Sanders.

Exhibit 13. An Anti-Oil Politician Selling The Windfall Profits Tax SOURCE: Twitter
Not surprisingly, according to Sanders, it is un-American to earn a profit. Yes, $174 billion sounds like a lot of money for the oil and gas industry, but it is chump change next to the sums Sanders and his cohorts shovel out the door in their spending bills. Their spending figures begin with the letter “t.” Moreover, the profit figure Sanders quoted represents the amount for the entire oil & gas industry. We are not sure where the number comes from, but that is less important than the fact it is dwarfed by the profits of the top five U.S. technology companies who last year netted $363.3 billion. This is based on the annual or trailing twelve months profits for 2021 taken from 10-k’s and quarterly reports. The contributions of those five tech companies were: Apple ($100.6 b); Microsoft ($71.2 b); Alphabet [Google] ($76.0 b); Amazon ($76.4 b); and Meta Platforms [formerly Facebook] ($39.4 b). Given those high profits, the five tech giants are highly prized by the stock market – valued much higher than oil and gas companies – although tech companies are valued less today than they were last fall. The last time we checked, neither Sanders nor any of the other Democrat senators have advocated a windfall profits tax for the tech industry. Just think how much money they could raise for the federal treasury with such a tax.
Before we examine the last time the oil and gas industry was subject to a windfall profits tax, we should examine the structure of this proposed tax. We have only read the House bill but assume the two Congressional bills are identical. The bill is 22 pages in length, as the concept and mechanism for taxing oil companies and dispersing the revenue is straight forward.
First, Congress determines who will be taxed. The bill states:
COVERED TAXPAYER. —
(A) IN GENERAL. —The term ‘covered taxpayer’ means, with respect to any calendar quarter, any taxpayer if—
(i) the average daily number of barrels of taxable crude oil extracted and imported by the taxpayer for calendar year 2019 exceeded 300,000 barrels, or
(ii) the average daily number of barrels of taxable crude oil extracted and imported by the taxpayer for the calendar quarter exceeds 300,000.
Any oil company producing or importing 300,000 barrels a day of oil, as defined in the bill, either in 2019 or in the current calendar quarter, will be subject to the windfall tax. This definition encompasses pure oil producers and oil refiners. Exempt from the tax are small oil and gas producers and operators of small refineries. This structure helps in the narrative to sell the bill as it is targeting only those “big, bad oil companies” and not the “mom-and-pop producers.”
Next is determining what is taxed. The definition of “taxable crude oil” means crude oil, crude oil condensates, and natural gasoline. These are the raw materials for producing gasoline and heating oil, which the oil companies are using to price-gouge working families according to the Democrats.
The tax rate will be 50% and it is to be levied on the product of the difference between the average Brent oil price for the specific quarter and the average Brent oil price between January 1, 2015, and December 31, 2019, and the number of taxable crude oil barrels quarterly. The tax will be paid quarterly.
Using spot oil price data from the Energy Information Administration (EIA), we calculated the 2015-2019 base Brent price at $57.12 per barrel. With the current quarter’s average Brent oil price through March 7, 2021, of $94.72, the windfall tax would be based on 50% of $37.60 ($94.72-$57.12), or $18.80 per barrel times the number of barrels produced or imported. Assume a ‘covered taxpayer’ produces 300,000 daily barrels on average for the current quarter and we use the same average prices as above, then the producer will have a $507.6 million tax bill. Just think about what happens if you produce on average only 299,999 barrels per day – you don’t owe $507.6 million in excise taxes.
The promoters of the windfall tax legislation estimate that “At $120 per barrel of oil, the levy would raise approximately $45 billion per year.” Because the aim of the tax is to help working families suffering from the high price of gasoline and heating oil, the legislation directs the government to send checks quarterly to those people using the tax proceeds. [During the pandemic, the federal government has perfected the art of sending checks to people.] According to the Congressional tax promoters, “At this price, single filers would receive approximately $240 each year, while joint filers [couples/families] would receive roughly $360 each year.” A great selling point to rally support for the bill among other congressional members, although not a lot to offset the higher energy prices.

Exhibit 14. Using Brent Actually Boosts The Tax Burden On American Oil Producers SOURCE: EIA, PPHB
What is interesting in this windfall tax proposal is the absence of any recognition or acknowledgement of the actual workings of the international oil industry. The law uses the Brent oil price as its tax basis, which is an acknowledgment that the price is set by global oil market dynamics. Secondly, there is a penalty for American oil companies by being taxed based on Brent. Traditionally, Brent oil has sold at a premium to West Texas Intermediate (WTI). As shown in the chart above, the difference between the Brent and WTI average price for the base tax period (2015-2019) is $4.16 per barrel. As the chart shows, there were periods of time, especially in 2016, when Brent and WTI were priced almost equally. Most of the time, Brent was priced higher. The problem is that today, this Brent/WTI price difference, based on average prices for 2022 year-to-date, is $4.66 per barrel. That means that the current average Brent price premium over the base period value is $37.60 a barrel compared to a WTI spread of only $37.10. American oil and gas companies will be paying tax on an even more expensive barrel than if they were taxed on WTI prices.
Moreover, there is no provision in the legislation to account for oil companies that have hedged their output, which in a rising oil price market reduces realized revenue. Therefore, an oil company’s actual profitability from producing oil if it hedged the output would be less than the theoretical profitability determined by using Brent spot market prices. Oil companies would be taxed on mythical profits they never earned.
It is also important to note that the windfall profits tax is, as the draft bill states, an excise tax. That negates the idea that the government is taxing oil company profits. Rather, they are being taxed on the price of a barrel of oil, but only certain barrels. As an excise tax, the money paid will be deductible against an oil company’s federal income tax liability.
This is not the first time the U.S. decided to punish oil and gas companies for being in a commodity business where prices oscillate, and financial and operational booms and busts result.
The last time America experimented with taxing oil and gas company windfall profits was in the 1980s. Its implementation followed on a nearly decade-long era of oil price controls that had begun as part of a national effort to control prices and wages in response to accelerating inflation but were extended as oil prices continued to soar due to geopolitical events. Oil prices were controlled longer because Congress feared the world’s run-up in oil prices would drive up the cost of home heating oil, which was much more important to the U.S. economy in the mid-1970s than it is today.
The sequence of events that caused oil prices to be regulated started in the 1960s as U.S. oil production growth slowed. By 1970, it was clear U.S. oil output had stopped growing and was declining. More significantly, the 20-year global oil surplus was ending with the supply pendulum firmly swinging into a deficit, putting upward pressure on prices, and boosting the demands on Middle East producers to increase production.
For the U.S., the peak in domestic production meant we were destined to increasingly rely on imports for our oil supply. That watershed event made the U.S. economy more susceptible to geopolitical pressures, especially those engineered by OPEC. The U.S. further aided the cause of Middle East oil exporters by reducing the Federal oil depletion allowance from 27.5% to 22.0%, reducing the profitability of the domestic oil business.
With the Suez Canal still closed from the 1967 Six Day War, a tractor accidentally ruptured the TAP pipeline in Syria in early 1970. That cut off 500,000 barrels per day of Saudi Arabian oil flowing to Lebanon. The accident immediately sent global tanker rates soaring and began pushing up the inflation rate worldwide. Given this new world, Libya’s leaders decided to use their newfound leverage to raise posted oil prices and increase the tax rate from 50% to 55% for oil companies operating in their country, a move which was followed later by Iran and Kuwait. In December 1970, at the OPEC meeting in Caracas, the 55% tax rate was affirmed as a minimum for the cartel and demands were made that posted prices be raised to reflect changes in foreign exchange rates.

Exhibit 15. The TAP Oil Line Was A Crucial Supply Source In The 1970s SOURCE: Wikipedia
The changed global oil market empowered OPEC to dictate that any oil company refusing to pay the 55% tax rate would face a “total embargo” of its oil lifting rights. The oil companies quickly agreed and posted prices were raised, which started a series of increases. Soon Algeria nationalized 51% of French oil company concessions in the country. New negotiations between OPEC members and Western oil companies led to a 35% increase in posted prices, establishment of a 2.5% annual posted price increase plus inflation allowances, and tax rates being ratcheted up to 60%. The summer of 1971 was capped with Venezuela’s Hydrocarbons Reversion Law that mandated a gradual transfer to government ownership of all “unexploited concession areas” by 1974 and “all their residual assets” by 1983. The power of the supply pendulum was swinging further in OPEC’s favor.
On August 15, 1971, President Richard Nixon imposed a 90-day freeze on all wages, prices, salaries, and rents in the United States. More significantly for global oil markets, Nixon closed the “gold window,” which had ensured that holders of U.S. dollars always could exchange them for physical gold. This move impacted the value of the dollar, reducing the income of oil exporters who were paid in dollars. This caused OPEC to direct its members to negotiate price increases to offset the dollar’s devaluation. The global oil price spiral was on, but not in the U.S.
The August freeze initiated the first phase of oil price controls, which was followed in November by a second phase. Phase II was planned to allow for 2%-3% annual wage and price increases, approved by “Wage Boards” or “Price Commissions,” but domestic petroleum prices remained frozen at Phase I levels. There were ultimately three phases to the general wage-price freeze, but when Phase III ended in 1973, Phase IV was instituted, effective from August 12, 1973, to April 30, 1974, which retained price controls on oil. During this entire price control period, domestic crude oil prices remained fixed at their August 1971 level.
The 1973 Arab Oil Embargo followed the Yom Kippur war in October 1973. It lasted from October 1973 to April 1974 and impacted the U.S. and a few western countries who had supported Israel. In response, the U.S. enacted the Emergency Petroleum Allocation Act of 1973 in November 1973. That Act created a two-tiered price control program, with domestically produced oil from wells drilled prior to 1973 categorized as “lower tier (old) oil,” and oil from more recent wells designated as “upper tier (new) oil.” Under the 1973 Act, a Crude Oil Entitlement Program was created, as well as other programs intended to subsidize and protect small refiners.
Old oil, or oil produced from wells operating prior to 1973, was price controlled at roughly $4.25 per barrel. There was an additional allowance made for wells that were producing below their 1972 output. Later this ceiling price was raised to $5.25 per barrel. New oil, as well as stripper oil (from wells producing less than 10 barrels per day), and imported oil were exempt from price controls. That oil could be sold at the market clearing price, which was determined by the delivered prices of imported crude inclusive of customs duties to refineries.
The goal of these regulations was to protect the American consumer from the exploding global oil prices driven by geopolitical tensions and the disappearance of the long-term oil supply surplus that had existed since the end of World War II. There were several attempts to end oil price controls, but each effort included some form of windfall profits tax. None were enacted until President Jimmy Carter introduced plans to lift oil price controls gradually over an 18-month period, but his proposal included a windfall profits tax. Carter told the American public in an address that “Unless we tax the oil companies, they will reap huge and undeserved windfall profits.” Carter suggested using the revenues from the windfall profits tax for mass transit, oil price relief for poor families, and the development of alternative energy sources. Congress agreed, and on April 2, 1980, Carter signed the Crude Oil Windfall Profit Tax Act (WPT).
Under WPT, every barrel of taxable oil was assigned to one of three tiers. The tiers were derived from the oil price controls and were based on the age of the oil well, the type of oil produced, and the amount of daily production. There were some oil barrels exempt from regulation including any owned by state and local governments, qualified educational or charitable organizations, or some Indian tribes and individuals. The tax burdens of the producers also varied depending on their status – independent producers, major oil companies, and integrated producers.

Exhibit 16. Status Of Oil Price Regulation At Start Of Windfall Profits Tax In 1980 SOURCE: CRS, Lazzari
The details for the three oil tiers as of 1979 are shown in the table above. It is interesting to note the production volumes for each tier. This data was taken from a 2006 Congressional Research Service report prepared by Salvatore Lazzari analyzing the WPT in response to a request from Congress, as it considered a new WPT in 2005 given the rapidly escalating global oil price.
The WPT was collected on the first sale of taxable oil, typically when a producer sold it to a refiner. Refiners were required to withhold the tax from the payment to the producer and deposit the funds into an account semimonthly. The buyer was also required to file quarterly returns reflecting those collections. The WPT was designed to be temporary. While there was some flexibility built into the plan, the tax was targeted to disappear over a three-year period beginning between 1988 and 1991, depending on revenues raised.
In 2005, as Congress began considering another WPT, the results of the prior tax was crucial. Although there were reasons put forth for why Americans were entitled to a share of oil company profits, the reality showed it would be detrimental to the health of the economy. Besides, projections seldom are met (ask any oil executive about his oil price forecasts) and the burden of the tax and its enforcement can produce adverse outcomes – most particularly, falling production.
Lazzari’s report contained the following table of expected versus actual revenues raised from the WPT. Part of the reason for the large shortfall is that the assumption for global oil prices to continue to rise throughout the decade of the 1980s proved wrong. According to the report, the oil price in 1980 was $32.37, yet only $13.25 in 1988. As the figures show, when oil prices were high and rising, substantial sums were collected. Otherwise, the tax revenues raised were immaterial.

Exhibit 17. 1980s WPT Raised Much Less Revenue Than Expected SOURCE: CRS, Lazzari
Not only did the WPT generate less revenue than government officials and politicians anticipated, it also negatively impacted domestic production. Inversely, with less domestic output and rising demand, the volume of imports increased, further putting the economy at risk of geopolitical tensions, and potentially even higher international oil prices.

Exhibit 18. How The WPT Harmed Domestic Oil Output And Boosted Oil Imports SOURCE: CRS, Lazzari
Lazzari prepared an analysis of the impact of WPT on domestic production and imports. (See the table above.) In preparing his calculation, he made estimates of the price elasticity of domestic oil supply to changes in the domestic oil price. If his estimates are accurate, the WPT cost us domestic production. The potential lost output ranged anywhere from 3% to 13% of the volume of oil output, substantiating that our economy experienced more oil imports than would have happened absent the tax. As the chart shows, in 1981, the potential lost domestic production ranged from a low of 77 million barrels, or 2.1% of actual output, to a high of 310 million barrels, or 8.3%. When this lost domestic production is measured against actual oil imports, the result was an even greater impact, ranging from 4.8% to 19.3% of total imports.
If similar dynamics exist today, and we have no reason to think they do not, then the current WPT proposal will hurt our domestic oil production and boost our imports and raise our energy bills given the spread in prices. One could surmise that these are the objectives of those sponsoring the WPT legislation. We certainly hope saner heads in Congress prevail and defeat the effort.
Investigating the historical record of the harm inflicted by the 1980s WPT on the economy, society, and the energy industry should conclude that it will hurt the very people these politicians are hoping to help. We didn’t talk about the role of the 1970s oil price controls in creating gasoline and heating oil shortages, which certainly weighed on the economy and family lives. Nor did we focus on the unproductive expense for the oil and gas industry, as well as the Internal Revenue Service, in operating and monitoring the WPT, besides the cost of auditing and collecting the taxes. These are unnecessary financial burdens for citizens and corporations.
In a world that was already facing an extremely tight oil supply/demand balance, which is now being aggravated by the Ukraine/Russia war and the resulting geopolitical tensions and economic sanctions, adding another upsetting variable makes no sense. But in politics, especially when it is related to energy, sanity is often lacking. Having attacked the domestic oil and gas industry since January 20, 2021, pillorying companies for “price gouging” and “profiteering” may be a political strategy that backfires this time. We can only hope.
Controversial Daylight Savings Time And Saving Energy
We noticed last week that the U.S. Senate, by unanimous consent, passed the Sunshine Protection Act of 2021, a bill that will keep our clocks on one time for 12 months of the year. This will make Daylight Savings Time (DST) permanent, rather than turning clocks ahead in the spring and back in the fall. The legislation, if approved by the House and signed by the President, would end the clock shifting starting in November 2023 when we would not need to turn clocks back. According to Rep. Steny Hoyer (D-MD), there is no timetable for the House to consider the bill, but the House Committee on Energy and Commerce signaled bipartisan support at a hearing. More recent political articles suggest there is growing dissent over the bill, but who knows?
When the bill was re-introduced by Sen. Marco Rubio (R-FL) and his co-sponsor Sen. Ed Markey (D-MA), they highlighted the health and economic benefits of making DST permanent.
“The rate of heart attacks spikes by 24 [percent] in the days following ‘spring forward’ in March, according to a 2014 study from the University of Michigan. Another study, published in 2016, found stroke rates may also increase by eight percent.”
“Year-round daylight savings time could also decrease the likelihood of fatal car accidents, which jump six percent in the days following the time change, according to a 2020 study from the University of Colorado.”

Exhibit 19. Congress Moving To Eliminating Changing Clocks SOURCE: Reuters
The idea of DST has a mixed history, often starting with widespread support, sometimes motivated for patriotic reasons, but eventually seeing that support decline. The idea of changing clocks to extend the hours of daylight was jokingly suggested by Benjamin Franklin in a 1784 letter. In 1895, New Zealand entomologist George Vernon Hudson recommended a 2-hour time shift to extend evening daylight to provide him more time to hunt for insects. The more substantive effort to create DST came during World War I, led by Germany, while the U.K. debated it but never implemented it. “War Time” was popularized by those countries as they examined ways to save energy. In the U.S., the 1918 effort to create DST and four time zones, was objected to by President Woodrow Wilson who vetoed the legislation. Congress, in a rare move, overrode the veto. Several years later, the war time experiment was sidelined by farmers who pointed out that they relied on the early morning light to guide them when bringing crops and dairy to market and the time change was disrupting these efforts.
In 1942, President Franklin Roosevelt enacted a second war time across the United States to cut energy use in support of the war effort. That time shift ended in 1945 when the war ended. At that point, states were allowed to set their own time. Before long, the U.S. Naval Observatory found that 71 of the largest U.S. cities followed DST, while 59 did not. As a result, they called America “the world’s worst timekeeper.”
The next time we experimented with the clock was 1966 with the Uniform Time Act that established six months of DST and six months of Standard Time. That experiment lasted about two years. It was revived again in 1974, when year-round DST was enacted by President Nixon to save energy at the time of the Arab Oil Embargo. There was overwhelming support for the move, but eventually wintertime darkness became an issue, as thousands of school children were injured in morning accidents in the dark. This prompted some schools to shift their starting times to ensure they did not start until daylight.
Will the current effort to make DST permanent prove successful? Reports are that surveys show overwhelming support for the move, even though the public acknowledges the safety risks. They are focused on the health benefits of the move and believe accommodations for safety can be made. The issue about saving energy has proven inconclusive. During the 16-month experiment in the 1970s, the Department of Transportation could not prove any savings, but the officials suggested they believed eventually 100,000 barrels per day of oil could be saved. We wonder if the Biden administration will tout the energy-saving benefit in making DST permanent, assuming it is passed by the House of Representatives. Better yet, maybe they can adjust the clock to make the sun shine all day, which would certainly overcome solar power’s intermittency problem.
Leveraging deep industry knowledge and experience, since its formation in 2003, PPHB has advised on more than 150 transactions exceeding $10 Billion in total value. PPHB advises in mergers & acquisitions, both sell-side and buy-side, raises institutional private equity and debt and offers debt and restructuring advisory services. The firm provides clients with proven investment banking partners, committed to the industry, and committed to success.
