

Energy Musings - November 23, 2021

Energy Musings contains articles and analyses dealing with important issues and developments within the energy industry, including historical perspective, with potentially significant implications for executives planning their companies’ future. While published every two weeks, events and travel may alter that schedule. I welcome your comments and observations. Allen Brooks
Offshore Wind Meets Inflation And Consumer Cost Rises
The first federally approved offshore wind project is moving forward. Its cost has jumped by 25% and its LCOE is higher than Lazard’s estimates and all the data is secret in a regulatory filing.
Great Heat Pump Transition Is Underway, Or Is It A Scam?
Heat pumps provide a non-fossil fuel heat alternative. But they are expensive and use lots of electricity when temperatures fall below freezing, limiting regions where they are competitive.
Have You Heard Enough About Carbon Emissions?
COP26 was all about limiting or ending carbon emissions. The latest CO2 data shows that global emissions were flat for the past decade. Glasgow’s attendees failed to reconcile that news.
Biden Giveth And Taketh Away At The Same Time
The Biden administration is throwing tax subsidies and credits at climate change. The Build Back Better bill changes taxes that hurts green energy project economics. Biden’s agenda at risk?
COP26 Climate Change Speech Stunt Fails History Test
Tuvalu minister delivers COP26 message of island nations’ fear of sinking under rising sea levels. Thirty years of these forecasts have been wrong. Studies show island nations are growing.
Offshore Wind Meets Inflation And Consumer Cost Rises
Offshore wind is a centerpiece in the Biden administration’s climate change effort. Earlier this year, during a conference with leaders of many of the world’s industrialized countries, President Joe Biden announced that the United States was not only committing to reducing its carbon emissions by more than it had previously stated, but as part of that effort, it would decarbonize the country’s electricity grid by 2035. Biden further indicated that the U.S. would be building 30 gigawatts (GW) of offshore wind capacity by 2030. The administration then moved quickly to approve the Vineyard Wind project off the coast of Massachusetts, as well as to begin the process to increase the number of offshore wind lease sales held in the future.
At the present time, there is one 30-megawatt (MW) wind farm operating off Block Island in Rhode Island state waters, consisting of five 6-MW wind turbines. (Recent report is the wind turbines are not working.) There also are two 6-MW wind turbines installed in federal waters off Virginia City. These two turbines initially were used to collect data for use in planning a much larger wind farm. Once the test data was collected, the turbines were shifted to electricity generation status providing power to customers of owner Dominion Energy.
Meeting both the offshore wind and electricity decarbonization goals will be a tall order. Last year, 40% of the electricity generated in the United States came from carbon-free sources. However, half of that amount was from nuclear power plants with an additional 7% from hydropower. That left 13% of power coming from wind, solar, biomass, and geothermal.
According to one expert, growing U.S. renewable electricity from 20% to 80% in 14 years will require increasing renewable energy generating capacity to three-times the current 285 GW of installed capacity. Achieving such a goal will require building 55 GW of new renewable generating capacity per year on average. The electricity industry built 60 GW of natural gas generating capacity in each of 1999 and 2000. There has never been more than 15 GW of renewable generating capacity built in any single year. These numbers highlight the magnitude of the burden the Biden administration is placing on the electric power industry, although with sufficient and long-lived subsidy enticements, power developers just might reach this target.
Unfortunately, the expert offering this information did not indicate whether his generating capacity figure included hydropower’s capacity. There is little appetite in this country for building more dams to generate hydropower. That increases the amount of other renewable generating capacity needing to be built. When we consider the size of the generating capacity construction effort facing the industry, we know costs will rise. Of course, none of that potential impact is being considered in the discussions about how we are to decarbonize our electricity system and what that effort may cost. However, we are seeing early signs of the cost impact in recent news releases from participants in the renewable energy space, especially wind and offshore wind.
The mainstream media has failed to focus on the various warnings about cost inflation for builders of renewable energy projects. Warnings about the huge increases in steel, resins, and aluminum prices – double-digit and sometimes triple-digit hikes – are squeezing operating margins of equipment manufacturing companies. To rising raw material costs, one must add the increased expense for transportation – higher shipping rates and longer port access times – to gain a full appreciation for what is happening to the costs of renewable energy components. Three manufacturers of turbines and other wind components (Nordex, Gamesa, and Vestas) cited these inflationary pressures impacting their revenue and profit projections for the balance of 2021 and in 2022.General Electric’s renewable business warned that the uncertainty surrounding the extension of tax credits had hurt its orders and left the company estimating negative free cash flow for the business this year.
As the push for more renewable energy capacity grows, it is impossible to see how these higher costs will reverse in the near-term. Thus, assumptions of ever lower renewable energy costs are probably no longer valid. What will that mean for ratepayers who are constantly assured that the renewable energy transition means lower electricity prices? So far, all ratepayers are seeing is higher electricity bills. Will they be willing to accept a future of ever rising electricity prices?
The most high-profile renewable energy announcement came recently from Dominion Energy, the electric and gas utility that operates in 16 states across the United States but is the primary utility in Virginia. It announced it had submitted its application for Coastal Virginia Offshore Wind (CVOW) with the Virginia State Corporation Commission (SCC), the state’s utility regulator. This will be the first federally approved offshore wind farm.

Exhibit 1. How Virginia’s Offshore May Begin To Look In A Couple Of Years SOURCE: gwec.net
CVOW is the planned 2.6-GW offshore wind project, consisting of 176 14.7-MW wind turbines, to be located in the 112,800-acre lease area some 27 miles off the Virginia coast and extending 15 miles eastward. While Dominion highlighted the scope of the project and the various contracts it had awarded for turbines, the installation of the foundations, the purchase of the cabling to be installed to bring the power to shore, and the construction of the first Jones Act-compliant offshore wind turbine installation vessel, it only mentioned in passing that the project’s total cost had increased from $8 billion to roughly $10 billion, a 25% increase.
Interestingly, the project’s new cost estimate is $9.8 billion that exactly matches the amount approved by the Virginia General Assembly in 2020 when it passed the Virginia Clean Economy Act (VCEA) that strips regulators of some of their traditional decision-making powers over utility projects but directs the SCC to approve up to $9.8 billion in customer cost recovery for the wind farm. The law both requires Dominion to be 100% carbon-free by 2045 and sets a 5.2-GW target for offshore wind capacity.
The passage of the Virginia legislation conjures up memories of the re-writing of the Rhode Island public utility rules by that state’s legislature to outlaw the use of cost/benefit analysis by the public utilities commission in scrutinizing the economics of Deepwater Wind, the wind farm located off the coast of Block Island. That legislative re-writing came after the commission initially rejected Deepwater Wind for being too expensive for the state’s ratepayers.
According to Dominion’s CEO Bob Blue, the reason for the increased cost included commodity pressures, completing the conceptual design, and stakeholder engagement for the onshore transmission route. The share of the increase attributed to each reason was not spelled out. However, we believe the “commodity pressures” were a significant factor. Why? Because we have seen three manufacturers of wind turbines announce reduced profit forecasts due to rising raw material costs and logistics issues in their respective earnings calls with investors. They also indicated they would, if they have not already, raise prices.
Blue indicated that customers would pay a net average of $4 per month for the wind farm, but that the company expects savings from future tax-credit legislation would reduce customer costs. We assume this is in reference to the proposed extension of the wind tax subsidy in the Build Back Better bill being debated in Congress.
According to Power magazine, Dominion expects that CVOW will have a projected installation cost of $3,800 per kilowatt-hour ($/kWh), which includes the cost of transmission. They also suggest that the projected levelized cost of energy (LCOE) for CVOW is $87 per megawatt hour ($/MWh). Blue noted that with further expansion of tax credits for offshore wind, the cost for customers could fall to $80/MWh.
Blue further noted that the LCOE is “substantially lower than the $125/MWh maximum established by the VCEA.” However, achieving the lower LCOE figure requires that “the project’s construction commences prior to 2024 for U.S. income tax purposes or as a plan to enter service prior to 2028.” These targets are in reference to U.S. federal income tax rules that to be eligible for wind tax credits, a certain percentage of a project must be done prior to the end of 2024 to qualify. Thus, the pressure to move forward as rapidly as possible to ensure meeting this date, as otherwise the economics would be drastically upset.
A key point in the company’s assessment of its LCOE is that it believes the project will achieve a lifetime capacity utilization factor of 43.3%, up from the initial plan for only 41.5%. This is an important variable employed in the LCOE calculation. As Blue stated, “This is beneficial both for the project as well as our customers because higher generation will result in a lower LCOE.”

Exhibit 2. Offshore Wind’s LCOE Estimates May Be Off Due To Poor Assumptions SOURCE: Lazard
Looking above at the 2021 LCOE calculations for offshore wind prepared by investment bank Lazard, recognized as the leading source of LCOE estimates, we find that CVOW has a higher capital cost, a lower capacity factor, and a higher-than-average LCOE. According to Lazard’s analysis, the low and high end of its offshore wind capital cost estimates are $2,500 to $3,600/kWh. Lazard used capacity utilization figures of 53% and 49% for the low and high analyses, respectively. Lastly, Lazard sees the LCOE falling between $66 and $100/MWh, with an average of $83/MWh figure.
What conclusion should we draw from Lazard’s LCOE calculations, given the Dominion analysis? The capacity utilization figures used by Lazard raise serious questions about its LCOE estimates, when we know Dominion’s figure is based on a year or more of actual data from its test turbines and new engineering data from the turbine manufacturer. Note that the Dominion capacity figure has increased by 1.8 percentage points of utilization, but its maximum capacity estimate is still six to ten percentage points below Lazard’s figures. A higher capacity utilization means more wind power generated and a lower LCOE, all other assumptions remaining constant. This comparison suggests Dominion’s LCOE estimate would fall into the lower end of the Lazard range if Dominion’s turbines achieved the much higher capacity utilization estimates.
The greatest problem is that all the Dominion data and calculations about LCOE, as well as its claim for 97% uptime operation of the wind turbines, the foreign currency hedges for the 40% of the project purchases from foreign sources, and other operating considerations, have been filed under secrecy provisions with the SCC. Are there assumptions that should be questioned? Hopefully, the SCC will open the eleven volume 61 document filing to public scrutiny.
This points out the sensitivity of economic evaluations of offshore wind, or any energy source, to the assumptions about how much power they can put out consistently over the life of the plant. For fossil fuel plants, we have extremely long histories of their performance, so the LCOE calculations are less susceptible to error. Renewable projects have less data, but many assumptions about trends impacting their LCOE. Those assumptions are going to be challenged for the next several years, because the belief that renewable power is always going to get cheaper is not the case as the turbine manufacturers and solar panel providers are attesting.
Great Heat Pump Transition Is Underway, Or Is It A Scam?
As part of the effort to reduce carbon emissions, home and commercial heating has been targeted. If we can get people to heat their homes and businesses with electricity or some other clean energy method rather than fuel oil or natural gas furnaces, we can eliminate a chunk of emissions. The preferred tool is the heat pump. Such a heating transition, at least in one country, has become a battle between climate activists and energy realists. The heat pump transition in Britain is setting up to be a massive and expensive undertaking.
While heat pumps have been around for decades, their prominence as a home heating device has gained stature in recent years due to climate change. Just as electric vehicles (EV) are considered the best alternative to internal combustion engine (ICE) vehicles since they do not emit any pollution from their tailpipes, heat pumps are touted because they do not combust any fossil fuel when generating heat in a home or business.

Exhibit 3. Standard Heat Pump In The U.K. SOURCE: Daily Mail
For the U.K. government, heat pumps are seen as the best way to transition away from fossil fuels and help in the country’s effort to meet its carbon reduction commitment from the 2015 Paris Agreement. In 2020, the U.K. government released a report titled: “United Kingdom of Great Britain and Northern Ireland’s Nationally Determined Contribution.” In the report, there is a brief description of the country’s history with carbon reduction commitments related to United Nations’ programs. From a lofty, but unenforceable carbon reduction target, the U.K. moved to more specific targets along a path to reach net zero emissions by 2050. Quoting from the report:
The legally binding Climate Change Act (2008) sets a framework for the UK to reduce GHG emissions and build capacity to adapt and strengthen resilience to climate risks. The Act originally committed the UK to cut its emissions by at least 80% below the 1990 baseline level by 2050. On 27 June 2019, this target was amended, committing the UK to a legally binding target of net zero emissions by 2050, set on a whole-economy basis.
The Climate Change Act introduced carbon budgets for the UK Government, which cap emissions over successive five-year periods and must be set 12 years in advance. The first five carbon budgets cover the period from 2008-32, with the sixth carbon budget (2033-38) due to be set by mid-2021.
The Act also established the CCC [Committee on Climate Change] – the independent statutory body that advises the UK Government and Devolved Administrations on climate change mitigation and adaptation, including emissions reduction targets. When providing advice, the CCC considers the UK’s international obligations under the Paris Agreement and the UNFCCC [United Nations Framework Convention on Climate Change].
One of the steps the U.K. government instituted in early 2019 was to ban the installation of gas furnaces in new home construction from 2025 under its Future Home Standards program. The government also announced that people would be unable to purchase new gas furnaces from 2035 forward. This forces existing homeowners to retire their gas furnaces when they wear out with low carbon heating systems, primarily heat pumps. These moves were to help eliminate the 14% of U.K. carbon emissions estimated to come from homes.
This effort led to the Boiler Upgrade Scheme, in which the government offered U.K. households up to £5,000 ($6,726) to help install low carbon heating technologies, including heat pumps. The plan generated a significant backlash. While it only banned the installation of fossil fuel-fired furnaces in new homes from 2025, many in the U.K. said it would be better to attack retrofitting existing homes where emissions were emanating rather than in new homes. The problem quickly became the costs associated with such a policy switch.
A report from the CCC said it would cost £26,300 ($35,381) to install low-carbon heating in an existing home, while installing it in a new house would only cost £4,800 ($6,457). The economics of the low-carbon furnace switch kicked off a key climate change battle. It was heightened by the CCC stating that for the U.K. to meet its carbon emissions reduction target, it needed to eliminate virtually 100% of its emissions from homes.
As National Grid, the U.K.’s electricity provider put it in a short article on the Internet:
Reducing the carbon footprint of our home heating involves two main elements: looking at the best fuel source to produce heat in the first place; but also reducing the loss of that heat once it is created, by having as effective insulation as possible. The challenge is that every home is different – some new, some old, some large, some small – so it’s hard to find a one-size-fits-all approach in such a complicated property landscape.
They went on to state that making a switch to a low-carbon heating source for a new home is simple because you are starting with a blank layout. The home can be better insulated, the optimal heating system can be employed without consideration of the challenges of fitting systems into limited space. Furthermore, existing homes have different amounts of insulation, which is difficult to upgrade. Then there is the challenge of figuring out how much space is available to position the new heating unit.
There are 27.5 million existing homes in the U.K., according to National Grid. If we use the CCC’s estimated cost to retrofit a home with a new heat pump, and excluding the cost of additional insulation, consumers would be spending £715 ($962) billion to equip all the homes. That expenditure would equate to 35% of the U.K.’s 2020 Gross Domestic Product, all to potentially save 14% of the nation’s carbon emissions by 2050. Some homes have furnaces that can operate on hydrogen, although this is not a realistic or economic option. The government currently is undertaking a test of hydrogen-fueled furnaces.
There are two types of heat pumps currently available. Air source heat pumps (ASHP) pull ambient heat from the air and increase the temperature using a compressor. This hot air is then used to heat radiators and water. Ground source heat pumps (GSHP) are similar but draw heat from pipes buried in the ground where the temperature is warmer and constant. These ground source heat pumps have higher up-front costs but run more efficiently. Because they depend on ground space for the pipes, their use is limited to more rural areas and those properties with larger lawns.

Exhibit 4. How A Heat Pump Works In A Home SOURCE: Daily Mail
While debate over the cost of heat pump retrofits versus new installations raged, some people began examining and questioning the economics of operating them and whether they provided the same heat quality as traditional fossil fuel-fired furnaces. There have been numerous newspaper articles and columns by builders and analysts about the operation and economics of heat pumps and biomass stoves. One article went as far as to harken back to 1980 when British Gas, the nation’s gas utility at that time, was extolling “wonderous” gas, which was coming from the booming North Sea. Its advertisements also trumpeted that the gas came “at a price that can’t be beat.” Of course, we all know that the U.K. now is in an energy crisis that has sent natural gas, as well as coal and oil, prices soaring – well beyond that price that cannot be beat.
Higher fossil fuel prices should be a positive for heat pump economics. But heat pump economics remain challenging. At the core of the analysis is the coefficient of performance (COP) of a heat pump.
Because heat pumps use refrigerants to transfer heat, they can supply more heat energy than the input electricity. The measure of efficiency is known as the coefficient of performance (COP). The efficiency of a heat pump is the ratio of useful heat energy produced relative to the electrical energy consumed. The heat pump does not create energy nor is it more than 100% efficient. It achieves its efficiency by using heat energy already present in the outside air, ground, or water.
In technical terms, COP is written as Q/W. where Q is the heat generated and W is the power used. Assuming 5 kilowatts (kW) is the heat output from the heat pump, it is generated by using 2kW of electrical energy and 3kW of energy from outside air. Therefore, the COP of the heat pump is 2.5, as shown in the chart below. The higher the COP rating, the more efficient the heat pump, and the lower the operating cost.

Exhibit 5. Calculating Coefficient Of Performance For A Heat Pump SOURCE: Daily Mail
The crucial determinant of COP is the outside temperature. The analysis presented for heat pumps in the U.K. is based on an average air-source heat pump. When the outside temperature is above 7º C (44.6º F), then the COP will be 3.2 when distributing heat to an underfloor heating system. The problem is that Met Office (organization that maintains the nation’s historical temperature record) data shows that the average U.K. temperature from November to March (1971-2001) is constantly below 7º C. The monthly average varies between 4.2º C (39.6º F) and 6.9º C (44.4º F). Therefore, the COP will be lower than usual, around 2.8, given variations in the outside temperature.
When it is mild outside, COPs of 4.0 may be seen. However, in those cases, the system has probably been switched off because it is so warm. But if the temperature is freezing or below, the pump must work harder, and the COP will be well below 3.0. Therefore, there is a need for a Seasonal Performance Factor (SPF), which measures the total useful heat that has been generated annually from the heat pump and then divided by the annual electricity consumption.
A survey by the Energy Saving Trust found an SPF average of 2.45 for an air-sourced heat pump, based on 44 homes spread geographically around the U.K. No extra insulation was installed. The study was conducted in 2013, so it is possible that newer installations may be slightly more efficient. However, the heat pump installations monitored in 2013 were engineered for best practice, including, for example, visits by manufacturers to check and advise on best practice. Therefore, it seems unlikely that new installations now will be significantly more efficient.
Another group promoting heat pumps calculates that the SPF is 2.8, but it assumes a “well insulated house plus new radiators.” Thus, it seems reasonable to perform an economic analysis using the average SPF of 2.6, assuming no extra insulation. The analysis follows:
According to OFGEM, the nation’s utility regulator, the latest price cap is 19.1 pence (26 cents) per kilowatt hour (kWh) for electricity, and 3.8 pence (5 cents) per kWh for natural gas.
A typical house would use 15,000 kWh of gas a year, split between 11,000 kWh for heating and 4,000 kWh for hot water.
Assuming an energy efficiency of 85%, a natural gas furnace would produce 9,350 kWh of usable heat [11,000 x 85%], at a gas cost of £418 ($562) [11,000 x 3.8p].
To produce the same 9,350 kWh of usable heat, a heat pump would use 3,596 kWh of electricity, at a cost of £687 ($924).
Heat pumps face another major problem, which is hot water. A typical ASHP can only heat water to about 50º C (122º F), which is well below the threshold of 60º C (140º F), below which Legionella bacteria thrives. There are various solutions such as a separate immersion tank or a top-up system to superheat the ASHP water flow, but these and other alternatives will both cost money to install as well as to run. The cost will be more to run than operating a gas furnace, as they would need electricity.
The analysis shows that even if all the Environmental Levies of the U.K. government were switched from electricity to natural gas, heat pumps would cost roughly £90 ($121) a year more to run than a gas furnace. These economics, as well as the cost of installing a heat pump and making other upgrades to a home to accommodate it, are what have kicked off a battle over the government’s proposal to ban gas furnaces. Listed in the graphic below are estimated costs of various units and upgrades necessary to equip a home with a heat pump and to make it cozy during winter months. Additional insulation and underfloor warming are needed if a heat pump is going to be able to provide the comfort of existing gas furnaces.

Exhibit 6. What Is Required For Transforming A Home For Heat Pump Installation SOURCE: Daily Mail
The comparable dollar cost estimates are:
Internal wall insulation: $9,412
External wall insulation: $11,429
Cavity wall insulation: $807 - $3,227
Lost insulation: $592 - $995
Air source heat pump: 5,916
Ground source heat pump: $12,101
Hydrogen-ready boiler: $4,034
Underfloor heating: $9,412+
EV charger: $471 - $1,345
As heat pumps are increasingly being promoted as the future for home heating, we found an interesting post on the website windtaskforce.org dealing with an analysis of the economics of heat pumps in Vermont. The post is extremely detailed with links to reference material on the various topics covered. The economic analysis showed the sensitivity to temperatures. In this case, the homeowner had a 35-year-old, 3,600 square foot, well-insulated and sealed home, which helped in the performance of the heat pump. Still, the homeowner elected not to operate the heat pump at winter temperatures below 15º F, in contrast to most others in Vermont who stop using theirs at 28º F. At low temperatures, the COP falls, meaning electricity usage skyrockets, making an efficient, in this case, propane furnace more economical to operate. The performance of heat pumps at low temperatures highlights their challenge in regions where winter temperatures are extremely cold. Economics and comfort dictate the maintenance of a traditional fossil fuel furnace, which can add to the annual operating expense of heating and cooling for homeowners, as well as creating problems if a homeowner replaces the entire heating system with a heat pump. Economics are further influenced by the cost of electricity available to the homeowner.
The Vermont homeowner “installed three Mitsubishi heat pumps, rated 24,000 Btu/h at 47F, Model MXZ-2C24NAHZ2, each with 2 heads, each with remote control: 2 in the living room, 1 in the kitchen, and 1 in each of 3 bedrooms.”
“The HPs have DC variable-speed, motor-driven compressors and fans, which improves the efficiency of low-temperature operation.”
The turnkey cost of the heat pumps was $24,000 with the local utility providing a $2,400 subsidy.
The following is taken directly from the blog post but does not get into issues such as the amortization of the investment in the heat pump, carbon emission reductions, and hourly operating costs. These are all topics the Vermont homeowner discussed in his very long blog.
Energy Cost Reduction Due to HPs is Minimal
HP electricity consumption was from my electric bills.
Vermont electricity prices, including taxes, fees, and surcharges, are about 20 c/kWh.
My HPs provide space heat to 2,300 sq ft, about the same area as an average Vermont house.
Two small propane heaters (electricity not required) provide space heat to my 1,300 sq ft basement.
I operate my HPs at temperatures of 15F and greater; less $/h than propane.
I operate my traditional propane system at temperatures of 15F and less; less $/h than HP.
My average HP coefficient of performance, COP, was 2.64.
My HPs required 2,489 kWh to replace 35% of my fuel.
My HPs would require 8,997 kWh, to replace 100% of my fuel.
The average Vermont house COP is about 3.34.
The average Vermont house requires 2,085 kWh to replace 27.6% of its fuel, per VT-DPS/CADMUS survey.
The homeowner’s analysis concluded the following:
Before HPs: I used 100 gal for domestic hot water + 250 gal for 2 stoves in basement + 850 gal for Viessmann furnace, for a total propane of 1,200 gal/y.
After HPs: I used 100 gal for DHW + 250 gal for 2 stoves in basement + 550 gal for Viessmann furnace + 2,489 kWh of electricity.
My propane cost reduction for space heating was 850 - 550 = 300 gallon/y, at a cost of 2.339/gal = $702/y.
My displaced fuel was 100 x (1 - 550/850) = 35%, which is better than the Vermont average of 27.6%.
My purchased electricity cost increase was 2,489 kWh x 20 c/kWh = $498/y.
My energy cost savings due to the HPs were 702 - 498 = $204/y, on an investment of $24,000!!
One of the issues the homeowner explored was the cost of his carbon emissions savings by installing the heat pumps. He performed the analysis in two ways – market-based and location-based. In the case of market based, he used the calculation promoted by the pro-renewable energy organization in Vermont, Energy Action Network, which relies on a figure from the Vermont Department of Public Service. Their calculation is based on the power purchase agreements (PPA) the utility signs with low-carbon electricity suppliers, regardless of whether the power is actually consumed in Vermont. The VT-DPS number is 33.9 grams of CO2 per kilowatt hour (gCO2/kWh), which is a low number for the carbon content of the state’s electricity supply.
Using that low number, the homeowner’s “CO2 reduction is 4.897 - 3.253 = 1.644 Mt/y, based on the 2018 VT-DPS “paper-based” value of 33.9 g CO2/kWh.”
As the homeowner explained, the utilities get their power from the ISO-NE grid, which operates the New England states’ power supply. Thus, there cannot be a New Hampshire CO2 figure and another one for Vermont, etc. By using the ISO-NE measure, the carbon content of the region’s power supply is 317gCO2/kWh.
Using that location-based figure, the homeowner calculated his “CO2 reduction is 4.897 - 3.897 = 0.939 Mt/y, based on the 2018 ‘real world’ value of 317gCO2/kWh, as calculated by ISO-NE.”
Using the ISO-NE figure, the homeowner found that “Cost of CO2 Reduction is ($2059/y, amortizing - $204/y, energy cost savings + $200/y, service, parts, labor) / (0.939 Mt/y, CO2 reduction) = $2,188/Mt, which is outrageously expensive.”
As the homeowner showed, EAN has used the low carbon number to promote how much CO2 can be reduced if residents install heat pumps. The EAN claim is that 90,000 heat pumps by 2025 would eliminate 0.37 million metric tons of CO2 in 2025, or the equivalent of 4.111 Mt/y per installation. Thigh number is achieved by assuming 100% displacement of fossil fuels (natural gas, propane, and fuel oil). This assumption is unrealistic because the actual fuel displacement in Vermont houses with heat pumps was only 27.6%, based on a VT-DPS-sponsored survey of heat pumps in the state. That figure is in line with the homeowner’s experience with his well-insulated/well-sealed home, which displaced 35% of his fuel use. He estimates that the EAN 100% claim would only be true for about 1.5% of all Vermont homes. Of course, the average Vermont house would need two to three heat pumps, at a turnkey cost of at least $20,000, to achieve the 100% displacement. In other words, the claim is dramatic, but it falls drastically short of achievement in the real world because the assumptions, which are never discussed, do not reflect reality, especially if costs are considered.
While heat pumps are touted as the optimal way to reduce home and business heating emissions, the reality is somewhat different. As the homeowner in Vermont reported, heat pumps are not very efficient when the temperature drops below freezing, making their use somewhat limited geographically. Ideally, heat pumps should be used in temperate regions, or acknowledged as not 100% solutions for heating in regions where colder temperatures during the winter prevail. In this regard, we found a set of charts that display Europe’s and North America’s major cities on the other respective continent both interesting and instructive for where heat pumps could be best utilized.
When we look at maps of the world, we often are surprised to see where various countries and cities lie compared to others half-way around the world. Immediately below, we have displayed the chart showing North America and Europe aligned by latitudes. We then have cropped respective continents and expanded them (slight distortion) so the names of cities can be more easily read.

Exhibit 7. How Continents And Their Cities Align By Latitudes SOURCE: Brilliant Maps
What is surprising is that Spain aligns with the lower portion of New England and the Mid-Atlantic states. While Amsterdam and London are aligned with Chicago.

Exhibit 8. North America With European Cities Superimposed SOURCE: Brilliant Maps
Likewise, people have a hard time understanding that Houston is aligned with Cairo, Egypt and Fairbanks and Anchorage, Alaska are aligned with Iceland.

Exhibit 9. Europe With North American Cities Superimposed SOURCE: Brilliant Maps
While climate conditions around the world vary due to jet streams and other migrating weather patterns, the latitude comparisons of countries and cities provides some guidance about where heat pumps might be best utilized. As the Vermont analysis and the U.K. economics discussion suggest, heat pumps are very valuable carbon reducing tools in certain locations, but not in all. Claims about their carbon reduction powers are largely overblown because most are based on unrealistic assumptions. As a result, the economic argument for heat pumps is weakened when they assume reduction benefits unlikely to be attained, while their expensive costs are being forced on people. Do not expect honesty in this debate to break out anytime soon. And in the U.K. that debate is starting now, with the distinct possibility the question of heat pumps may be put up for a vote by the public. Potentially the first true test of the Green New Deal.
Have You Heard Enough About Carbon Emissions?
COP26 is history. As we predicted in our last Energy Musings, a “monumental” agreement was reached at the conference’s conclusion, although it required an extra day to hammer it out. Fossil fuels were identified in the final communique. That reality was acknowledged by U.S. special presidential envoy for climate John Kerry at COP26’s final news conference. Kerry indicated that in his 30 years of attending these climate meetings, this was the first-time coal and fossil fuel subsidies have been addressed in the final communique. “That’s never happened…” He pointed out that big countries dependent on coal have signed on to phasing down their reliance, a watered-down version of the original language to “phase out” coal.
As Kerry told reporters, “Coal and the phase-down of coal is on the books. You have to phase down coal before you can end coal. So, this is a beginning. We always knew Glasgow was not the finish line.” He went on to say, “Paris built the arena and Glasgow starts the race.” Of course, we are still in an era of pledges not penalties, and the leaders of the largest polluters skipped the conference. The largest polluters continue to ask the smallest to bear much of the pain of transitioning to renewable energy. Yet when the developing countries suggest they need significant financial aid to facilitate such a transition, the money from the developed countries is not there. Lots of ‘happy talk’ but not much substance.
In August, when the Intergovernmental Panel on Climate Change (IPCC) released its Sixth Assessment Report (AR6), United Nations’ Secretary-General António Guterres called the report ‘code red’ for climate change policy actions. After heightening the need for swift and aggressive actions, Guterres said:
We need immediate action on energy. Without deep carbon pollution cuts now, the 1.5°C goal will fall quickly out of reach. This report must sound a death knell for coal and fossil fuels, before they destroy our planet. There must be no new coal plants built after 2021. OECD [Organization for Economic Co-operation and Development] countries must phase out existing coal by 2030, with all others following suit by 2040. Countries should also end all new fossil fuel exploration and production, and shift fossil-fuel subsidies into renewable energy. By 2030, solar and wind capacity should quadruple, and renewable energy investments should triple to maintain a net-zero trajectory by mid-century.
Despite some comments, pledges, and commitments to actions along the path outlined by Guterres, most of his ask was not embraced. In his closing comments, he said, “As I said at the opening, we must accelerate action to keep the 1.5-degree goal alive. Our fragile planet is hanging by a thread. We are still knocking on the door of climate catastrophe.” He later stated, in keeping with his August assessment of AR6, “It is time to go into emergency mode – or our chance of reaching net zero will itself be zero.”
Kerry gave us the latest deadline before climate catastrophe envelopes the world. Kerry said, “We have nine years, this decade, this decisive decade.” One more doomsday date we must live with. Quoting the climate activist Greta Thunberg: “blah, blah, blah.”
Last week, The Breakthrough Weekly email landed in our inbox. It was titled: “Can we afford more emissions?” In this edition was a paper by three of the Breakthrough Institute’s climate experts: Seaver Wang, a senior climate and energy analyst, Vijaya Ramachandran, and Zeke Hausfather, the Director of Climate and Energy at Breakthrough. Their paper was titled: “The Rich World — Not Sub-Saharan Africa — Needs to Lead on Decarbonization.” It was a rebuttal to the idea that the rich, developed nations should be leaning on the least developed and poorest nations, especially those in Africa, to bear the burden of the climate change energy system transition. The article focused on how miniscule the CO2 emissions of Sub-Sahara Africa (SSA) are relative to global emissions. The key point was that even if SSA’s emissions doubled or tripled, they would still fall within the annual fluctuations of global carbon emissions.
While SSA emissions is an interesting issue, the bigger story is the data upon which the article is based. Earlier this month, Hausfather authored an article that focused on a major revision to global carbon emissions data. The revisions are due to reductions in the amount of carbon emissions coming from land-use change. The bottom line of the revised data is that global CO2 emissions have remained flat for the past decade, although they are rebounding in 2021 from the sharp decline experienced in 2020 driven by pandemic economic shutdowns. This analysis is radically different from the narrative that CO2 emissions are on a relentless march upward.
The analysis is based on the latest data from the Global Carbon Project (GCP) that collects CO2 data. While the article contains a statement that this edition of the carbon emissions data has not been peer reviewed, it marks the 16th edition of the “global carbon budget” and previous ones were peer reviewed. Therefore, we believe it is safe to assume that the data is accurate. Our confidence in that assumption is bolstered by the fact that Hausfather would not have written his analysis if he had the slightest concern about the quality of the GCP data.
The GCP data shows the planet is on track for a 4.9% increase in global emissions this year, following a 5.4% decline in 2020. With this rebound, 2021 global emissions will total an estimated 39.4 gigatons of CO2 (GtCO2), putting the total 0.1 GtCO2 above the 2011 total. This revised assessment of global CO2 emissions comes from a sharp reduction from land-use change emissions. The 2021 GCP almost halves the estimate of net emissions from land-use change over the past two years – and by an average of 25% over the past decade. Although fossil fuel emissions represent 90% of global emissions, the revision to the other 10% is having a significant impact on the estimate of total emissions. With respect to the rhetoric of constantly rising CO2 emissions, it is really focusing on fossil fuel and cement emissions.
The chart below shows the new estimate of global CO2 emissions from the 2021 survey (solid line) versus the 2020 assessment (dashed line). Note that from 2000 to 2010 the two data series reflect a steady upward trajectory with the 2021 survey’s line falling slightly below the 2020 projection. The two lines meet in 2011, but from that point forward they diverge. The 2020 assessment continued the trajectory of the earlier decade, reaching a peak in 2019 before the pandemic-induced decline. The new 2021 data series shows CO2 emissions varying year by year but showing no growth since 2010 even after the projected increase this year. The shaded area in the chart represents the one-sigma range of uncertainty for the 2021 data series.
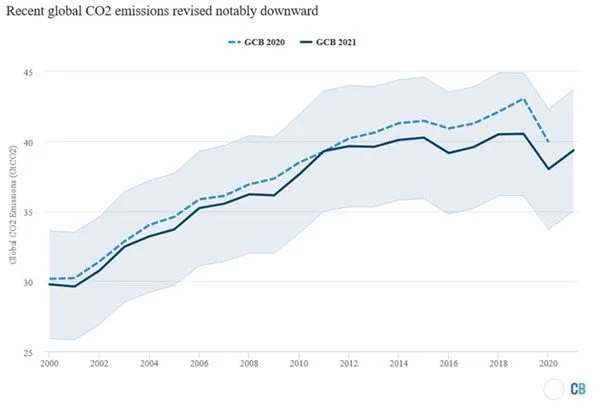
Exhibit 10. Global Carbon Emissions Have Been Flat For The Past Decade SOURCE: Carbon Brief
Previously, the GCP data showed carbon emissions increasing by an average of 1.4 gigatons of CO2 per year (GtCO2) from 2011 to 2019. The new data shows emissions were flat – increasing by only 0.1 GtCO2 per year during that period. When the 2020 and 2021 data is included, the new data series shows slightly declining global emissions over the past decade.
The new data series also lowers the historical (1750-2020) cumulative emissions by roughly 19 GtCO2 compared to the 2020 data series. That reduction is equivalent to half a year of current global emissions. The significance of the reduction is that it slightly increases (~4%, or half a year of current emissions) the remaining “carbon budget” of around 460 GtCO2 from the start of 2021. That means we have 11.5 years at the current CO2 emission rate to limit global warming to 1.5º C (2.7º F) with a 50% likelihood.
As Hausfather pointed out, the reduction in global CO2 emissions is almost totally attributed to revised land-use change emissions. The chart below shows the impact of the revision in the 2021 data series (solid blue line) compared to the 2020 data (dashed blue line). The land-use change emission data covers a much longer historical period than the earlier chart of global CO2 emissions. From 1960 to 2000, there are only modest differences between the two data series. That changed during the last two decades, as the 2020 series showed a steady increase in carbon emissions, while the 2021 series showed a steady decline up to 2019 before falling off sharply in 2020 and then continuing to decline in 2021. The result is that over the past decade, rather than land-use change emissions growing by 1.8% per year, they have declined by 4% per year.

Exhibit 11. Revised Land-Use Change Emissions Lowered Overall Carbon Emissions SOURCE: Carbon Brief
The land-use change data comes from GCP using the average of three different observational-based land-use change data series, known as H&N, BLUE, and OSCAR. As can be seen in the graph below, these three data series were widely divergent over the past decade (light dotted lines) in the 2020 assessments. However, the 2021 data (bold solid lines) shows patterns in the earlier decades like the 2020 data, but then there are notable declines in emissions for all three data series over the past decade, bringing them all into alignment, although with some differences in the magnitude of declines within each data series. The History Database of the Global Environment (HYDE) now uses updated estimates of agricultural areas and land cover maps from satellites, which should be giving more accurate measurements. This shift has resulted in lower estimates of cropland expansion, particularly in the tropical region of the globe. What is unknown about these data series is how well they are capturing the deforestation of the Amazon in Brazil.
Climate scientists are increasing their use of satellite data in their research. The problem is that this data may be based on different measurements, and the satellite era is extremely short for climate change research. This shortening of the data history has helped some climate activists who want to highlight recent data trends as being an acceleration of trends. For example, measuring acreage burned in wildfires but by only starting the graphs from the early 1980s presents a misleading picture of the history of wildfires. The same with linking sea level increases from two different satellites with historic data sets to show an acceleration in the rise.

Exhibit 12. Land-Use Change Emissions Have Been Revised Lower In Last Decade SOURCE: Carbon Brief
Another aspect of the GCP data is the estimation of the amount of CO2 being stored in the ocean sink. This is the repository for the carbon not remaining in the atmosphere, as it must go somewhere. Climate change forecasts assume there is a limit to the amount of CO2 that can be stored in the ocean, and when that limit is reached, or climate variables cause dissolved carbon to be released from the ocean sink, global warming will accelerate. The chart below shows the latest research on the ocean carbon sink through 2020.
In the chart, the anthropogenic atmosphere-ocean CO2 flux, referred to as SOCEAN (black line with its uncertainty in grey shading), is shown, as well as individual ocean models (teal). The ocean FCO2-based data products is a measurement system enabling scientists to study ocean data more easily. The bars in the lower right of the chart show the number of fCO2 observations in the Surface Ocean CO₂ Atlas (SOCAT) database. The grey bars indicate the number of data points in SOCAT 2020 with the colored bars showing newly added observations in 2021.

Exhibit 13. The Surprisingly Larger Ocean Carbon Sink SOURCE: Breakthrough Institute
A 2020 guest post at Carbon Brief by two earth scientists from the University of Exeter in the U.K. expanded on their research into the ocean sink over 2011-2018. They had previously done research on the sink for 2010. Their conclusion is that the ocean is absorbing more carbon than previous thought.
It is estimated that the ocean may absorb 25% of the carbon emissions from human activity. Coupled with land surface, it is possible that as much as half the annual carbon emissions are being absorbed rather than remaining in the atmosphere. It is believed that prior to the industrial era, the ocean was a net source of CO2. However, with greater volumes of carbon emissions the ocean is becoming a reservoir. This is not without issues, as more CO2 can lead to changes in the chemistry of seawater, referred to as ocean acidification, which can impact marine life.
The challenge for scientists is to assess where the CO2 emissions are going. As the two British professors wrote:
Scientists can calculate the total human-caused emissions and observe how much of this CO2 stays in the atmosphere. The remainder must have been absorbed by either the land or the ocean. So, a good estimate of the ocean sink also enables calculation of how much is being taken up by the vegetation on land. Put simply, the CO2 that goes missing that doesn’t go into the ocean, must go into the land.
When these professors analyzed the data, they concluded:
While previous estimates put the ocean sink at around 2bn tons of CO2 per year, we find that it could be 0.8-09bn tons larger. Over the whole 27-year study period of 1992-2018, this means the global oceans have taken up 67bn tons of CO2 rather than 43bn.
According to the figures above, the oceans have absorbed 55% more CO2 that previously thought over the 26-year period studied. If the oceans are absorbing more carbon emissions than previously thought, which the two professors demonstrate and is shown in the chart above of the ocean sink’s growth, what does this mean for global warming and climate change? With less land-use change carbon emissions, does this suggest that the difference in the amount of CO2 we previously calculated and the new estimate has gone into the oceans? Could more CO2 be going into land sinks? Or does it mean we have a greater potential climate problem ahead? Maybe it means we really do not fully understand how CO2 works within our climate system. Remember, we were initially told that CO2 was the driving force for global temperatures, but the study of ice cores showed the opposite relationship to be true.
We are still trying to understand why the reduction in CO2 emissions during 2020 has never been reflected in the atmospheric measurements at Mauna Loa observatory in Hawaii or the other clear-air observatories that track the amount of carbon in the atmosphere. Our thought is that it is possible these observatories are seeing more of the natural carbon emissions cycle than fossil fuel emissions.
Thomas Harris has provided us with a slide showing the measured atmospheric CO2 recorded throughout time for three clean-air sites: Mauna Loa, the Antarctic, and the Arctic. As the historical graph and the exploded view show, all three data sets reflect similar steady upward trends with monthly oscillations reflecting hourly measurement fluctuations. In reading the methodology for calculating the Mauna Loa data, only some hours each day are counted because of the upslope and downslope of local winds that can bring or remove carbon from plant life at lower levels.

Exhibit 14. Carbon Emissions Climb Steadily In Clean-Air Observatories SOURCE: Thomas Harris
When we examine the most recent short-term measurement chart for the Mauna Loa observatory, we see that there has been no change in the pace of increase in CO2 during 2020. We do see monthly fluctuations that reflect seasonal (growing season) variations, which is part of the natural carbon cycle. Is it possible that because Hawaii is in the middle of the Pacific Ocean it is isolated from some of the fossil fuel emissions? If so, then why did total carbon emissions continue increasing in 2020 when all the other data series show declines? Unfortunately, we have no answer.

Exhibit 15. Most Recent CO2 Data For Mauna Loa Shows No Reduction In 2020 SOURCE: NOAA
A couple of observations from the English professors provide thoughts to contemplate. These were:
A larger ocean sink could imply that CO2 emissions are larger than currently thought or that the land sink is smaller than we currently think.
The sink seems to be increasing with time, especially in the last 20 years, and we believe this is because atmospheric CO2 has continued to rise rapidly, dissolving more every year into the surface waters.
These observations preceded their two charts (below) that show the ocean-atmosphere exchange of CO2 over the 2011-2018 study period. The top chart (a) shows the relationship for the entire world, while the lower chart (b) shows the northern and southern hemispheres separately. The colored lines show different estimates, while the thick black line shows the average. The charts follow the convention that the uptake of CO2 is shown as a negative. Therefore, descending lines indicated that the ocean is absorbing more CO2.

Exhibit 16. The Growing Ocean Carbon Sink SOURCE: Carbon Brief
To better help our readers understand the challenge of estimating the role of carbon sinks in our climate system, Harris provided us with a chart from a 2001 paper, “Recent Past and Future of the Global Carbon Cycle” published in the AAPG Studies in Geology. If this does not confuse you, nothing will.

Exhibit 17. How Carbon Emission Sinks Work SOURCE: AAPG
If the GCP data is close to correct, the world is in a better place than we thought not that long ago. Yes, there remains a lot of work ahead to clean up the global energy supply, but such an achievement can be reached. The question remains how much it will cost to further reduce our carbon emissions. Unfortunately, politicians listen to climate activists, few of whom seem to have any appreciation for cost/benefit analyses or whether focusing on adaptation and mitigation measures are better paths compared to overly expensive and social disruptive courses. We continue to believe that if we educate the public about the energy situation and the costs and benefits of the choices available to achieve a cleaner environment, they will make the correct decision, and not as Winston Churchill was reported to have said that “Americans can always be trusted to do the right thing, once all other possibilities have been exhausted.”
Biden Giveth And Taketh Away At The Same Time
We are amid the struggle to get President Joe Biden’s Build Back Better (BBB) legislation passed. The nearly $2 billion bill contains many social programs favored by progressive politicians. There are also numerous provisions related to the left’s push for a Green New Deal, such as a 10-year extension of the renewable energy production and investment tax credits, along with the option for developers to claim the subsidy as either a direct payment or as a tax credit. There is also an extension of the tax credit for the purchase of an electric vehicle (EV).
But the tax credit now comes with the added bonus of $4,500 if you purchase an American-made EV built in a unionized plant.
The BBB bill, estimated to cost $1.85 billion over the next 10 years, will be paid for with various changes to current tax rules, including targeting billionaires and others with high incomes, along with accounting gimmicks. One of the tax changes is the implementation of a minimum tax of 15% on a corporation’s book income. This provision will comply with the agreement Biden just convinced the other G-20 leaders to implement among all its members. We must make sure those 55 American corporations that paid no taxes last year pay their fair share!
Buried in the tax provisions is a provision doing away with the use of accelerated depreciation of capital investments. Yes, get those corporations that invest in their businesses but use accelerated depreciation to recoup their investment quicker and in the process reduce their tax bill. However, according to the American Clean Power Association (ACPA), such a move, coupled with the 15% minimum book income tax provision, would hurt the economics of clean energy projects, at a time when the Biden administration is pushing green energy investment.
According to the ACPA, the elimination of accelerated depreciation would raise the expense of renewable energy projects by 15% to 20% and result in the loss of 130 gigawatts (GW) of clean energy capacity. What will this do to the attractiveness of renewable energy investments to hedge funds and other leveraged financial players who have played a meaningful role in new green energy projects?
The Edison Electric Institute, the lobbying group for U.S. investor-owned utilities, has raised similar concerns over these tax measures, as they would impede investment in clean energy projects, cost billions of dollars in lost investments, and sacrifice thousands of potential industry jobs, while raising the costs of the clean energy transition the Biden administration is championing.
The ACPA has sent a letter asking the Democratic Congressional leadership to allow for renewable energy projects to qualify for accelerated depreciation even if the minimum corporate tax is included in the final bill. We found it amusing that one of the signers of the letter was Berkshire Hathaway Energy, confirming Warren Buffet’s view of renewable energy projects – they are only worth investing in for the tax credits.
COP26 Climate Change Speech Stunt Fails History Test
The two-week Committee of the Parties 26th gala (COP26) wrapped up a week ago. The sessions were marked by speeches from politicians, government officials, and climate activists warning against the dangers of the world failing to eliminate carbon emissions. One such message was delivered via video by Simon Kofe, the foreign affairs official from the Pacific island nation of Tuvalu.

Exhibit 18. Tuvalu Official Making Dramatic Climate Change Presentation SOURCE: The Guardian
Because of Covid-19 travel restrictions, one-third of Pacific small island states and territories were unable to send any representatives to COP26. Lacking high-level representation, Pacific nations feared their concerns about climate change would not be appropriately addressed at the conference. To dramatize his message, Kofe videotaped the speech standing knee deep in water at the far end of Fongafale, the main inlet of Tuvalu’s capital Funafuti, home to about 6,500 people representing 60% of the nation’s population.
In October, a World Bank report said that projected sea level rise could cost the Marshall Islands, a country in the north Pacific halfway between Hawaii and Australia, its status as a nation. With a population of 59,000 and a land mass of 70 square miles, it is considered one of the countries considered most at risk of sinking under the sea. The Marshall Islands is now the latest island nation projected to disappear due to rising sea levels, but none of the earlier islands targeted to be gone have disappeared. In fact, they have been found to be growing!
Kofe should have remembered that United Nations Secretary-General António Guterres posed for a similar picture for the cover of a June 2019 Time magazine issue when it wrote “Our Sinking Planet,” an article focused on sinking Pacific Island nations.

Exhibit 19. Dramatic Prediction Of Future Disasters SOURCE: Time
While sinking islands seems to be a recurring theme of climate change activists, we need only to go back to the September 1988 report by Agence France-Presse (AFP) stated that, according to government officials, a “gradual rise in average sea level is threatening to completely cover this [Maldives] Indian Ocean nation of 1,196 small islands within the next 30 years.” At the time, the country’s Environmental Affairs Director Hussein Shihab told AFP “an estimated rise of 20 to 30 centimeters [8-12 inches] in the next 20 to 40 years could be ‘catastrophic’ for most of the islands, which were no more than a meter [39 inches] above sea level.”

Exhibit 20. Unfulfilled Disaster Prediction SOURCE: trove.nla.gov.au
In 2012, the former president of the Maldives, Mohamed Nasheed, sounded climate alarm bells saying, “If carbon emissions continue at the rate they are climbing today, my country will be underwater in seven years.” That would have coincided with Guterres’ visit to Tuvalu in 2019. However, both the Maldives and Tuvalu are still above water. In fact, the population of the Maldives has more than doubled since the 1988 forecast of the island’s demise.
Furthermore, a 2018 study found that Tuvalu’s total land area grew nearly 3% between 1971 and 2014, despite rising sea levels. Satellite and aerial photos showed eight of Tuvalu’s nine atolls and three-quarters of its reef islands increased in size over the last four decades. The study’s lead author Dr. Paul Kench told AFP that “the dominant mode of change over that time on Tuvalu has been expansion, not erosion.” Kench made similar findings in a 2010 study. “On the basis of this research we project a markedly different trajectory for Tuvalu’s islands over the next century than is commonly envisaged,” Kench said. “While we recognize that habitability rests on a number of factors, loss of land is unlikely to be a factor in forcing depopulation of Tuvalu.”
As part of that 2018 study, nearly 90% of low-lying islands in the Pacific and Indian oceans were found to have either remained stable or increased in size over the decades. A more recent study by scientists at the University of Auckland found atolls in the Pacific nations of the Marshall Islands and Kiribati, as well as the Maldives archipelago in the Indian Ocean, have grown up to 8% in size over the past six decades despite sea level rise. The scientists used satellite images of islands as well as on-the-ground analysis to track the changes. Historical aerial images show how much Jeh's shoreline has changed over the decades.

Exhibit 21. An Example Of One Pacific Island And How It Has Grown Over The Years SOURCE: abc.news.au
Kench said coral reef sediment was responsible for building up the islands. "All the islands that we're looking at, and the atoll systems, comprise predominantly of the broken up corals, shells and skeletons of organisms on the coral reef, which waves then sweep up and deposit on the island," he said. "The majority of islands in each of those nations has either got larger or stayed very similar in size," said Kench. He acknowledged that about 10% of islands in the study had gotten smaller in size.
Coastal erosion from rising sea level is considered a major threat to many Pacific communities, with some already watching shorelines recede. Coastal erosion is impacted by wave action not sea level rise. Rising sea levels throughout history have yet to produce the disaster scenarios predicted for island nations for more than 30 years.
Leveraging deep industry knowledge and experience, since its formation in 2003, PPHB has advised on more than 150 transactions exceeding $10 Billion in total value. PPHB advises in mergers & acquisitions, both sell-side and buy-side, raises institutional private equity and debt and offers debt and restructuring advisory services. The firm provides clients with proven investment banking partners, committed to the industry, and committed to success.
