

Energy Musings - December 28, 2022

Energy Musings contains articles and analyses dealing with important issues and developments within the energy industry, including historical perspective, with potentially significant implications for executives planning their companies’ future. While published every two weeks, events and travel may alter that schedule. I welcome your comments and observations. Allen Brooks
Searching For The Clean Energy Holy Grail
A nuclear fusion ignition experiment was completed in early December in which more energy was emitted than injected that led to visions of unlimited clean energy. We examine why we are decades away from that potential and maybe even never due to problems with sufficient fuel.
Could Greenland’s DNA Find Alter Climate Change?
A new discovery of environmental DNA of animals and marine life from the northern region of Greenland shows that 1-2 million years ago the region was substantially warmer than thought.
Random Energy Topics And Our Thoughts
EV Journeys During Winter Are More Challenging
Offshore Wind: Virginia Go Ahead; Massachusetts Basket Case
Fossil Fuel Data Points And Comments
IEA Coal Report Continues Demand View For Plateau
Searching For The Clean Energy Holy Grail
Much like the Knights Templar, the scientists at the National Ignition Facility (NIF) at the Lawrence Livermore National Laboratory (LLNL) have been pursuing the holy grail of climate change – nuclear fusion ignition - that would unleash an unlimited supply of clean energy. According to U.S. Secretary of Energy Jennifer Granholm, speaking at a December 13th press conference in Washington, D.C., this band of NIF scientists has successfully achieved “fusion ignition.”
This breakthrough experiment is being hailed for its ability to accelerate the global energy transition away from fossil fuels with their carbon emissions to a world powered by 100% clean energy. While the NIF experiment’s success was a monumental achievement, the claim of a professor interviewed on a major television network’s news show that we will see unlimited clean energy displacing fossil fuels in a decade is wildly over the top.

Exhibit 1. Understanding How Nuclear Fusion Works SOURCE: FT.com
The LLNL scientists pursuing nuclear fusion ignition, in which two hydrogen atoms are fused into a smaller helium nucleus with the remaining mass released as energy as pictured above, have been part of the small group of scientists seeking to unravel this mystery since the 1950s and 1960s. Their efforts have involved exploring various technologies including the use of lasers, which is the focus of the NIF scientists. The 60-70-year history of fusion exploration contrasts with news stories suggesting the NIF’s research effort has lasted for slightly over a decade. That belief assumes that the effort only began when the government’s research commitment started in 2009 with the construction of the NIF laser facility, pictured below.

Exhibit 2. The NIF Facility With Several Lasers Mounted And Aimed SOURCE: LLNL
At the Washington, D.C. press conference, U.S. Secretary of Energy Jennifer Granholm announced that the NIF scientists had successfully achieved fusion ignition in which more energy was released than used to combine the two hydrogen isotypes. This experiment was hailed by government officials and the scientific community for being a huge technological breakthrough in the journey to a clean energy future.
It is important to understand what the NIF scientists accomplished and to acknowledge that success. However, it is also important to put the achievement into the proper context of the remaining scientific journey lying ahead before we arrive at an unlimited clean energy future. We have been monitoring developments in this quest for fusion ignition for more than a decade. Our efforts have included interviewing physics professors and other researchers actively pursuing the challenge, as well as reading research papers and news articles reporting on the experiments. These fusion ignition efforts have involved scientists from more than 50 countries conducting experiments involving numerous technologies, including the NIF’s laser-based efforts. Until recently, none of the efforts had been successful.
The NIF’s December 5th experiment was deemed successful because instruments monitoring the laser “shot” showed more energy having been released from the smashing together of the two hydrogen atoms than was needed to mash them. Although the ignition lasted for only a billionth of a second, it was a continuous release. Let us walk through the details and visuals to understand the experiment and its results.
The NIF contains 192 lasers. They are contained in the unit pictured earlier. The photo below shows some of the lasers in the unit viewed from above and looking down toward the target of their rays.

Exhibit 3. An Array Of Laser Beams Aiming At Target SOURCE: space.com
When the lasers are fired at their target, you would see the following picture.

Exhibit 4. Laser Beam “Shot” At Target SOURCE: New Energy Times
The fusion ignition experiment involved directing the power from the NIF’s 192 lasers at a gold cylinder, called a hohlraum, that is roughly the size of an eraser on the end of a pencil. Inside the cylinder was a pellet the size of a peppercorn, costing at least $1 million, that held a partially frozen mixture of two hydrogen isotopes - deuterium and tritium. The following exhibits give you a photographic perspective on how small the cylinder target is along with a schematic of where the pellet sits and how the laser beams target it. The power of the lasers creates heat and pressure that forms a plasma that forces the two hydrogen isotopes together and releases energy.

Exhibit 5. Holhraum Cylinder Holding The Fusion Fuel And Target Of Lasers SOURCE: New Energy Times
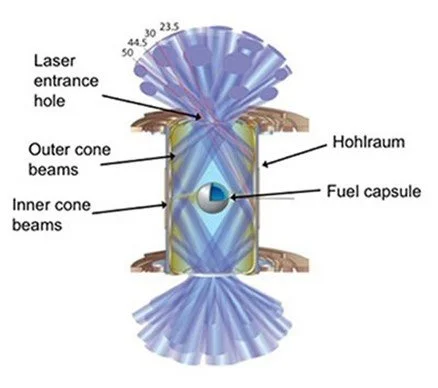
Exhibit 6. Cylinder With Fusion Fuel Being Hit By Laser Beams SOURCE: LLNL
The Wall Street Journal wrote in its coverage of the breakthrough experiment the following description of the fusion ignition process:
When laser beams entered the gold cylinder, they struck its inside walls and created X-rays. Those X-rays then bathed the capsule, creating a rapid implosion that superheated and crushed the fuel capsule to the width of a human hair.
Those extreme temperatures and pressures [more than 300 million degrees Celsius or 180 million degrees Fahrenheit and pressures more than 100 billion times Earth’s atmosphere] – like those in the cores of stars and giant planets and in exploding nuclear weapons – triggered a fusion reaction. The hydrogen atoms combined to form helium, releasing a tremendous amount of energy at the same time.
The NIF instruments monitoring the experiment confirmed that briefly – a moment lasting less than 100 trillionths of a second - 3.15 megajoules (MJ) of fusion energy output emerged from the capsule after it was blasted with 2.05 MJ of laser energy. The input, roughly the equivalent of a pound of TNT, resulted in a factor of 1.5 in energy gain with the release. However, as described by British fusion experts, the energy released from the experiment was sufficient to produce electricity capable of “boiling 10 kettles of water.”
The history behind the NIF experiment is enlightening for the significance of its success. The NIF began construction in 1997 and was completed in 2009 for $3.5 billion. Initial experiments proved disappointing as almost no fusion energy was created. In 2014, the NIF claimed some successes, but the amount of energy produced was the equivalent of what a 60-watt lightbulb consumes in five minutes. In August 2021, NIF conducted a “shot” whose outcome excited the scientists. That experiment found it had released energy equivalent to 70% of the laser energy input targeting the hohlraum.
As often happens with scientific breakthroughs, had you blinked during the experiment, you likely would have missed the entire operation and its outcome/success. In the moments after the December 5th shot, the scientists were unsure of what had happened. It was not until the first results from the instruments monitoring the test showed that more energy had been created than used, that scientists realized what they had accomplished. That is why banks of devices are utilized to monitor the tests.
Nuclear fusion ignition has been described by U.S. Rep. Don Beyer (VA-D), chair of the Bipartisan House Fusion Caucus, which educates Congressional members on breakthroughs and potential fusion energy, as the “holy grail of climate change.” Therefore, the excitement generated at the Washington press conference announcing the successful test was understandable, especially from Biden administration officials who have been promoting an anti-fossil fuel energy agenda. But experts, while praising the experiment’s results, were quick to point out that we are decades away from commercializing this technology.
First, we must understand that the NIF experiment, which demonstrated in a laboratory that the operation of the sun or a star can be replicated, used 300 MJs of grid electricity to power the lasers, according to the LLNL website. Thus, on a system-wide basis, the 3.15 MJs of energy released represented about 1% of the total energy needed for the experiment (300 MJ + 2.05 MJ). In other words, 99% of the energy used was destroyed in the experiment. An explanation for the loss was that the NIF lasers are only about 1% efficient.
Additionally, the lasers would need to fire between 10 and 30 times per second to generate electrical power output acceptable for the grid. And each time the eraser-sized cylinder would need to be reloaded. Imagine automating this process. There are also issues with harnessing the energy released from the shots and transmitting it to the grid. None of these issues are insurmountable, but what technological breakthroughs will be needed? How long might that take? And at what cost?
Before examining the next steps in the journey from the NIF fusion ignition to unlimited clean energy, we thought it appropriate to examine the reporting by the New Energy Times that assessed the outcome of NIF’s August 2021 test and whether fusion ignition was achieved. New Energy Times was founded in 2000 and is the leading online reference site for low-energy nuclear reaction (LENR) research. The site has been tracking the fusion ignition efforts, as well as developments in all other technologies working to create nuclear energy without employing nuclear fission, smashing atoms, and releasing nuclear waste.
NIF’s August 2021 test had the most promising outcome for fusion energy before this December’s success. In that earlier experiment, the energy released was equivalent to 70% of the input energy. The New Energy Times noted that NIF issued a press release on August 17, 2021, announcing that its experiment had reached the “threshold of fusion ignition.” Steven Krivit, writing for the site, discussed conversations he had with Kimberly S. Budil, the director of LLNL, and Omar A. Hurricane, the chief scientist for the inertial confinement fusion program at LLNL about the press release and later about the data. The LLNL officials “unofficially” acknowledged that the fusion test had achieved the historic threshold.
Krivit noted that “laser fusion is an informal term for a type of inertial confinement fusion.” He further commented that “most experimental fusion devices in the world initiate fusion through high temperatures, laser fusion does so by high compression.” This involves the “shot” of the laser hitting the cylinder that both heats and creates extreme pressures causing the fusion ignition.
The New Energy Times article continued with the following discussion about measuring fusion ignition:
When sufficient energy reaches the fuel, fusion reactions take place. The lab uses three metrics to measure progress.
Starting from the outside of the hohlraum and going in, the first metric is called target gain. This is the ratio of energy produced by the fusion reaction to the energy delivered to the entire hohlraum target. The second metric is called the capsule gain. This is the energy produced by the fusion reaction to the energy delivered to the fuel capsule. The third metric is called fuel gain. This is the energy produced by the fusion reaction to the energy delivered to the fuel.
For the Aug. 8, 2021, results, here are the three gain values:

SOURCE: LLNL
Given these results, Krivit wrote that he located pages on the LLNL website that define fusion ignition as “generating ‘energy equaling or exceeding the energy delivered to the capsule.’” Since the August test saw a capsule gain of 5.6 or a multiple of the LLNL definition of the threshold for fusion ignition, Krivit questioned Hurricane who acknowledged the result but cautioned that there were several definitions of ignition that they were working through before making a definitive statement, which he said would appear in a peer-reviewed publication.
When Krivit discussed the results with Budil, she conditionally agreed that according to LLNL’s definition, the test had achieved ignition. However, she acknowledged that a 1997 report by members of the nuclear fusion community under the auspices of the National Academies of Science established that the determining test would be based on “target gain rather than capsule gain.”
Budil later wrote to Krivit, “Yes, although the National Academies adopted the definition of target gain = 1 for ignition, we do not want to push on this until we have more data and hopefully a bit higher yield.” She went on to write that “[There is] no official declaration of ignition from us, although others have made this exact point in print.” Krivit noted that in the 24 years since the National Academies report, LLNL has had on its website numerous statements that “capsule gain, rather than target gain, is the lab’s reference measurement for ignition.”
We found the following discussion by New Energy Times very interesting.
Before we talk about laser fusion as a possible source for energy, it’s crucial to know that the primary purpose of NIF is to test nuclear weapons materials in an enclosed space rather than for fusion energy research.
So, what is the likelihood that the NIF device might ever demonstrate that laser fusion can be a source of energy? “Zero chance,” Hurricane wrote. “The NIF was never designed for net energy production since it’s just a research facility.” Here’s the math for the overall device gain, normalizing the electrical input energy to thermal energy based on a 33 percent conversion efficiency:

SOURCE: LLNL
It’s less accurate, but some people may prefer to compare the electrical input value to the thermal output value. Here’s what that calculation looks like:

SOURCE: LLNL
The Aug. 8, 2021, experiment, which produced 1.3 megajoules of energy, did so at an energy cost of at least the 400 megajoules required for the lasers. Regardless of whether the capsule gain value or the target gain value is used as the reference for the definition of fusion, the NIF device lost at least 99.7 percent of the energy it consumed.
The lab publishes this claim on its Web site: “Achieving ignition would be an unprecedented, game-changing breakthrough for science and could lead to a new source of boundless clean energy for the world.” The first part is credible; the second part strains credulity. The claim has been published on the LLNL Web site at least since 2014, long before Budil was in charge.
Why do we bring up this article discussing last year’s test? Maybe because we have seen one or two comments from scientists questioning the timing of the test and the breakthrough claim considering the government’s budget funding needs. We have not seen all the test results. We note that the release describing the test’s outcome focused on the energy input and output, conveniently ignoring the energy needed to power the lasers. Of course, considering the Target measure test, the greater energy released than utilized would appear to meet the test standard for fusion ignition. Maybe that was why so much was made of the energy released, although the August test that failed that measure still exceeded the LLNRL test standard for ignition.
Earlier this year, the Energy Department held a conference to discuss the prospects for nuclear fusion energy and to develop a plan for commercializing the technology. On the surface, the plan is detailed but not on a time scale that matches the commentary coming from those cheerleading the NIF December 5 test resutls. The following chart was included in the conference report.

Exhibit 7. Proposed Timeline For Development Of Pilot Fusion Power Plant SOURCE: Department of Energy
Notice that the plant design and construction is supposed to be finished in the early 2030s, potentially a decade from now. However, obtaining the fuel – tritium – is not set to begin until after the plant is built. There are serious questions about the availability of fuel that we will touch on later. Most importantly, the first major tests are to occur in the First Operating Phase which is targeted for 2035-2040. The plant is expected to operate smoothly in the interim, such that it will complete several operational cycles by 2050. Then the technology would be judged to be commercial and fusion power plants could be built. Assuming no technological issues emerge during this timeline, we are looking at the second half of this century before fusion energy could become a source of our electricity. Given that fusion energy is just now supposedly passing critical threshold tests, assuming it can become commercial by 2050 seems to be a stretch in our mind. That stretch may be complicated by the absence of fuel, which seems to be ignored or magically assumed to be available when needed in the planning process.
According to our research, the tritium used in the December 5 test cost $30,000 per gram. That cost is due to the limited availability of tritium. The current inventory has come from facilities associated with the U.S. nuclear weapons program. This will become a major hurdle because fusion reactor designs envision a 50/50 mix of deuterium and tritium, both are isotopes of hydrogen. Normal hydrogen will not work for fusion, nor will plants running exclusively on deuterium or tritium.
The primary source of U.S. tritium supply has been the Department of Energy’s Savannah River National Laboratory (SRNL). New Energy Times queried Scott Shaw, a public affairs officer for SRNL who said that the tritium produced at the Savannah River site will not be available for commercial applications as it is only for the military’s nuclear weapons stockpile.
There is no known tritium available in nature, so it will have to be manufactured. While some people suggest it can be extracted from ocean water, no system for doing it exists today. Sea water can be a source of unlimited supplies of deuterium, the other hydrogen isotope.
According to the World Nuclear Association “The main US source of tritium since 2003 apart from deactivated weapons has been special burnable absorber rods containing lithium in TVA’s Watts Bar 1 PWR. Supplies need to be replenished due to tritium’s half-life being 12 years, so decaying at about 5% pa.”
It is not like scientists have ignored the question of fusion fuel supply, it is more that they assume the technology and policy issues will be resolved in time for tritium supply, primarily from enriched lithium, to be available for the initial fusion plant. The greatest challenge with manufacturing enriched lithium is the production process. The following slide is from a presentation by Thomas Giegerich and three fellow authors at the Karlsruhe Institute of Technology titled “Lithium enrichment issues in the sustainable supply chain of future fusion reactors,” from 2016.

Exhibit 8. Presentation Summary Of Status Of Fusion Fuel Situation SOURCE: Karlsruhe Institute of Technology
In 2019, Giegerich and three other authors published a paper in Fusion Engineering and Design that furthered the discussion from the 2016 presentation. The paper, “Development of a viable route for lithium-6 supply of DEMO and future fusion power plants,” finished with the presentation of a timeline for developing this fuel supply. The enriched lithium plant timeline was developed by working backward from the 2050 date for the initial commercial fusion power plants. There was no discussion of which hurdles needing to be overcome are the most difficult or require the development of non-existent technologies.

Exhibit 9. Possible Timeline For Developing A Plant Producing Fusion Fuel SOURCE: Fusion Engineering and Design
As New Energy Times uncovered when it queried the authors of various presentations on fusion fuel, everyone acknowledges they have known of this fuel shortcoming in the development of fusion energy for years but always fall back on the view that there is time (and presumably the money) to develop the technologies and construct the facilities needed. What appears most challenging from our perspective is that the chemical technology to enrich and separate lithium-6 depends on environmentally disastrous processes. These choices are much like the issue of the amount of metal mining that will need to be done to meet the projected green energy revolution. How many environmentalists will applaud the magnitude of mining necessary?
The NIF fusion breakthrough experiment should be applauded. The actual outcome of the fusion ignition experiment was successful – more energy emerged than was used to generate it. What fails miserably is the experiment’s total energy input/output. The cheerleading for the experiment’s success ignored this latter point, which is critical for passing the economic test eventually. As we have uncovered in our research, there are many problems with the availability of the fuel needed for fusion energy, with little progress happening on resolving the issue. Some of the cheerleaders have suddenly wondered whether their cheers will lead to the government diverting the money they believe should be spent on wind, solar, and batteries, and leaving the world worse off with climate change.
Since the development of fusion energy is associated with nuclear weapons, commercializing the industry will require addressing the political problems associated with nuclear proliferation. We certainly will be watching developments in this area, as well as focusing on the tritium fuel business. We will report on developments when they happen. In the meantime, we applaud the fusion technical success of the NIF experiment, however, it comes nowhere close to solving the system-wide power in and power out challenge. Moreover, no one has any concept of physically how a power plant that employs lasers and hohlraums containing fusion fuel can meet the requirements of generating clean energy at grid scale. With other promising fusion technologies being developed and currently receiving the lion’s share of the private research money, we remain skeptical that this fusion energy breakthrough will be the holy grail of climate change.
Could Greenland’s DNA Find Alter Climate Change?
A recent study published in the journal Nature reports on the discovery of the existence of mammals and marine life in northern Greenland two million years ago. The extraction of environmental DNA, also known as eDNA, confirmed that this region was more temperate than previously thought before the climate cooled and the DNA became locked in permafrost. The discovery of the oldest DNA ever to be found on the planet was described by Kurt Kjaer, a geologist and glacier expert at the University of Copenhagen, as an opening of “the door into a past that has basically been lost.”
Environmental DNA is the genetic material that organisms shed into their surroundings. This DNA is crucial because animal fossils are hard to come by, but it also presents a challenge because the genetic material – hair, waste, spit, or decomposing carcasses – deteriorates over time leaving scientists with only tiny fragments to study. With the latest technology, researchers were able to extract genetic information from small, damaged bits of DNA, which allowed them to compare it with the DNA of different species looking for matches.
The DNA discovery came from a sediment deposit called the Kap Kǿbenhavn formation in the northern tip of Greenland as shown in the map below. Today, the area is described as an Arctic desert. Millions of years ago, the region was experiencing a period of intense climate change that sent temperatures soaring. Researchers suggested that sediment built up for tens of thousands of years at the site before the climate cooled and permafrost developed that helped preserve the bits of DNA until they were unearthed after drilling began in 2006.

Exhibit 10. DNA Found In Formation At Northern Tip Of Greenland SOURCE: Cambridge.org
During the region’s warm period, average temperatures were 20º F to 34º F higher than today. The region was filled with an unusual array of plant and animal life. The researchers reported that the DNA fragments suggest a mix of Arctic plants, such as birch trees and willow shrubs, with ones usually preferring warmer climates, such as firs and cedars.
To put the region in the proper geographic location, the following map of the world with the Northern Hemisphere highlighted shows that the northern tip of Greenland is close to the North Pole and at the top of the world. The discovery location included the DNA of animals including geese, hares, reindeer, and lemmings. Previously, the only signs of animal life at the site had been from a dung beetle and some remains of a hare. This wide array of wildlife reinforces the significance of the discovery.

Exhibit 11. Greenland Is About The Most Northernly Land Mass SOURCE: giantpumplins.co.nz
The most surprising discovery, according to geologist Kjaer, was DNA from a mastodon, an extinct species that looks like a mix between an elephant and a mammoth. Mastodons have been discovered in temperate forests in North America and in locations ranging from Alaska, Nebraska, and southern Idaho in the west to Ontario and New England in the east. They were also known to have lived in Florida, New Mexico, southern California, and as far south as Honduras during the early-middle Pliocene era about 4.5 to 3.6 million years ago. According to Love Dalen, a researcher in evolutionary genomics at Stockholm University who was not involved in the study, “I wouldn’t have, in a million years, expected to find mastodons in northern Greenland.” It is also interesting that they were found living there roughly two million years later than the Mastodons were residing in the southern regions of the United States and Northern Hemisphere. That suggests the discovery region was much warmer and for longer than previously thought.
Within the sediment accumulations at the mouth of the Greenland inlet, researchers were able to find clues about marine life from that ancient time. The DNA suggests horseshoe crabs and green algae lived in the area, meaning that the nearby waters were much warmer than they are currently, according to Kjaer.
These animal and marine life discoveries in northern Greenland are important in adding to our knowledge of the evolution of life on Earth. In our view, it is early to be drawing many conclusions about the implications of the discoveries, but we expect there will be some reassessments of past beliefs. We thought we would include the following chart showing the combined record of the world’s temperature and CO2 emissions history over the past 500 million years.

Exhibit 12. 500 Million Years Of The Planet’s Temperature And CO2 Records SOURCE: Climate Change and the Road to Net-Zero, Mathew Hampshire-Waugh 2022
These DNA discoveries showed that the animal, marine, and plant life that existed in northern Greenland 2-5 million years ago and was associated with much warmer average temperatures than now. And the discovery comes from a period when the world’s carbon emissions level was very similar to today’s level. Will we need to rethink some of our conclusions about climate change? Just asking a question.
Random Energy Topics And Our Thoughts
EV Journeys During Winter Are More Challenging
A recent article by the website Recurrent documents the decline in electric vehicle (EV) range in cold winter weather. The decline can be upwards of 35%. As the author of the battery article points out, model performance varies widely. He also suggests EV buyers living in cold weather regions carefully consider their EV selection and opt for the largest battery/greatest range they can afford to purchase to overcome the winter loss of range. However, if you never drive your EV very far, this criterion becomes less compelling.
Recurrent noted that numerous entities, including AAA, have tested EVs for winter range loss, but most only test one or two models and generally perform their tests in laboratories. Recurrent provides a link for EV owners to provide their vehicle data to the website to help in the research.
The chart below shows the range for 13 EV models at 70º F and 20º-30º F. The calculations include the vehicle manufacturer’s mileage claims as well as real-world driving data provided for over 7,000 cars, which includes over 35,000 data points.

Exhibit 13. Real-World EV Model Range Performance In Hot And Cold Weather SOURCE: Reourrent
Why do EVs have less range during winter driving? It is primarily a function of battery chemical reactions and physical processes such as regenerative braking that occur more slowly in cold temperatures. Additionally, EVs must generate their cabin heat because the small amount of heat generated by the electric motors is routed to warming the battery. Therefore, a cabin heater that draws power from the battery is needed for passenger comfort, reducing driving range.
The article published on the website contains individual vehicle charts showing each model’s performance over the range of temperatures. In some cases, there was information about cold-weather treatment for batteries provided by the manufacturer. The most significant discussion was associated with Tesla models because of the company’s system management. We are showing the discussion for the Tesla Model 3 when driven in winter conditions.
Tesla Model 3 Winter Range
Model or Trim: Long Range
Observed Range at 20-30F: 49% of Original EPA Range
Observed Range at 70F: 58% of Original EPA Range
Tesla is known for two things in the winter: having a very proactive thermal management system that kicks in at both high and low temperatures and for tightly controlling the onboard range estimates that drivers see. As evidenced below, it appears in the Model 3 dashboard data that there is almost no change in available range in cold or hot conditions.
This lack of response in the winter is because Tesla’s onboard computers synthesize a consistent experience. In the real world, drivers do experience a lower range in the winter and summer.
New to 2022, we have added observed, real-world range fluctuations to our Tesla data. The dotted line below shows the range as observed from onboard devices and energy usage. This shows a more expected decrease in the winter range, although Tesla's thermal management is still great at controlling cold weather range loss.

SOURCE: Recurrent
As a result of their research, the Recurrent team compiled a list of tips for avoiding winter range loss. Realistically, the list is a guide to help minimize the range loss as the recommended steps often assume the EV owner has her garage and charging station. The list includes:
Preconditioning is available in most EVs with a connected services app that allows you to warm up both the battery and cabin prior to actually getting in your car, all from your phone. Selected vehicles also offer a “winter weather” package that is specially designed to keep battery temperatures in an ideal zone.
Prepare for longer charge times. To protect the high voltage battery, many cars limit the charging voltage when the battery is cold. The thermal management system will usually lift the voltage restriction when the battery is warm enough to safely receive the full charge.
Warm your battery before charging. Building on the above, if your car has battery preconditioning, often part of a “winter weather” package, bring your battery to room temperature prior to charging. Alternatively, charging right after a trip will ensure the battery is warm.
Use seat and wheel warmers rather than only climate controls. These features use less energy and target the driver or passengers with heat, rather than spreading warm air around the cabin.
Turn down regenerative braking for winter driving as roads may be icy or cold. You will want to be able to engage your brakes more than in temperate conditions. Regenerative braking may also be limited by your battery management system if the battery is cold since a cold battery cannot charge as fast as a warm one.
Turn off some hardware features, like side mirrors that fold automatically. If the weather drops below freezing, side mirrors may get damaged or frozen stuck.
Store your Tesla plugged in. Teslas have very active thermal management, so if you’re going to see family for the holidays, or escaping to a beach for a week, consider lowering your charge threshold to around 70% and leaving your car plugged in. That way, the car can pull energy from the wall to keep warm, rather than using the battery. Otherwise, you may return to a lower battery capacity than expected.
We hope this list of tips and the chart of cold weather range loss is helpful to our readers who own EVs or are considering purchasing one.
Offshore Wind: Virginia Go Ahead; Massachusetts Basket Case
Offshore wind farms are making news. In Virginia, the State Corporation Commission (SCC) granted final approval for Dominion Energy’s massive Coastal Virginia Offshore Wind (CVOW) project but without the performance standard provision in its original approval. That provision was deemed “untenable” by Dominion’s Chairman, president, and CEO Robert Blue. The performance standard stipulated that on a rolling three-year average the wind farm produces 42% of its nameplate generating capacity. Dominion’s shareholders rather than Virginia ratepayers would have been on the hook for the cost of the supplemental power to make up that shortfall. This performance standard did not meet Dominion’s offshore wind business model.
The CVOW farm will consist of 176 wind turbine generators, each with 14.7 megawatts (MW) of capacity, located 24 nautical miles off the eastern shore of Virginia in a federal lease area. The combined nominal capacity of 2,587 MW is to be in full service by the end of 2026 or early 2027 at an estimated total capital cost of $9.8 billion including $1.15 billion for interconnection and transmission facilities. This project represents the largest capital investment and single largest project in Dominion’s history. Total project costs, including financing costs, less investment tax credits, are estimated to be approximately $21.5 billion, exceeding the company’s entire investment in its existing generation rate base, estimated at $18 billion.
In its final approval order, the SCC wrote:
Project is so great that it will likely be the costliest project being undertaken by any regulated utility in the United States. And the electricity produced by this Project will be among the most expensive sources of power - on both a per kilowatt of firm capacity and a per megawatt-hour basis - in the entire United States.
Whatever happened to cheap wind power? Moreover, since the expansion of interconnection and transmission facilities is still being engineered, the ultimate project cost remains unknown. But as the SCC also noted, should the project never become operational or is abandoned “due to cost, construction, or operational issues that make it imprudent or impractical to proceed,” the company will be able to recoup the money spent from ratepayers.
The SCC noted that it has not provided full approval of the project’s cost, as Dominion will be required to seek approval for investments annually. Additionally, through negotiations with intervening parties in the CVOW approval process, the performance standard was maintained but became a reporting requirement. Dominion must explain why the project fell short of the three-year rolling average generation threshold and to seek relief from the SCC. Thus, there remains a potential club overhanging Dominion’s wind farm performance, but we suspect there are so many loopholes in why the average underperforms that the company will never be held responsible.
Moreover, Commissioner Judith Jagdmann wrote a concurring statement after also agreeing to the SCC’s approval order. She pointed out that offshore wind was a category of clean energy investments ordered by the state’s legislators when they approved the Virginia Clean Economy Act and mandated the state’s two utilities produce 100% renewable electricity by 2045 and 2050. Her point was that “the General Assembly is uniquely positioned to align some of the costs of this Project (that currently will be paid solely by most of Dominion's customers), with the required consideration of the economic development benefits and clean energy attributes of this Project that advantage the Commonwealth more broadly.” Her message is that legislators needed to get active and figure out how to spread the CVOW cost over non-ratepaying Virginia residents.
Up the coast in Massachusetts, the offshore wind business is facing a different challenge. Avangrid Renewables, a subsidiary of Spanish energy giant Iberdrola has been struggling with an offshore wind project that suddenly is “uneconomic.” Avangrid asked the Massachusetts Department of Public Utilities regulators to suspend consideration of its Power Purchase Agreements (PPA) with three of the state’s utilities for electricity from the 1,223-MW Commonwealth Wind offshore project. Eversource Energy, National Grid, and Until refused to renegotiate the PPAs. The company says that its $72/megawatt-hour PPAs are no longer viable because of inflation and other economic disruptions and supply chain problems. It wants the agreements scrapped quickly so it can rebid in an upcoming solicitation scheduled for April 2023.
According to Avangrid’s Commonwealth Wind subsidiary, “Among other factors, the prolonged war in Ukraine has unsettled markets and increased costs for many products, inflation has been persistent, interest rates have increased in a manner unprecedented in recent times, commodity prices have risen sharply, and supply shortages and supply-chain constraints once thought to be temporary remain pervasive.” They also said, “cost increases for offshore wind equipment, such as turbines, have been ‘unprecedented.’”
Commonwealth Wind plans to bid in the April solicitation and offer its project with “cost-effective pricing, a superior timeline for completion, and exceptional economic development opportunities.” Was that what they said when they offered Commonwealth Wind’s power for sale the first time?
We remember the claims that offshore wind in Massachusetts was only going to get cheaper when those projects were up for bid.
There is another offshore wind project in the Bay State, Mayflower Wind, which is seeking to route its transmission line through Rhode Island state waters, up the Sakonnet River, across Portsmouth, and reenter Mt. Hope Bay, before making final landfall in Massachusetts. The sponsors of Mayflower Wind recently requested the Energy Facility Siting Board (EFSB) of the Rhode Island Public Utilities Commission to reschedule the Show Cause Hearing which was set for December 19th. The EFSB agreed. This will allow Mayflower Wind and its witnesses more time to prepare testimony and materials for the hearing.
On November 10, the EFSB issued its order requesting Mayflower Wind to show cause why the proceedings for its application should not be suspended after media coverage highlighted concerns about the project’s viability. As the EFSB stated: “The Board was in the process of finalizing its Preliminary Order and initiating its evaluation of the application when the Chairman of the Board learned that Mayflower Wind had recently requested the Massachusetts Department of Public Utilities suspend its contract approval proceeding for the Mayflower Wind project (whose Rhode Island transmission facilities are currently pending before the Board in this docket), citing concerns over the economic and financial viability of the project.”
The difference between Virginia and New England is that Dominion is the regulated utility that is developing the CVOW project, while the Massachusetts utilities are buyers of offshore wind power from various developers. If CVOW ends up costing much more than its estimated $9.8 billion price tag, will Dominion be back in front of the Virginia SCC seeking more relief? That is where the cost sharing agreement with intervening parties comes into play, but ratepayers have no protection on this massive wind farm failing to deliver the power promised. Offshore wind, expensive in every economic analysis, is sold to regulators as “cheap” and a boom for state economies. Those promises are evaporating.
Fossil Fuel Data Points and Comments
Europe Natural Gas Prices:
This year’s global energy crisis has opened many peoples’ eyes to the realization that fossil fuels are playing an important role in meeting the power needs of countries and will likely continue to play an important role for much longer than previously expected. Something has happened in all three fossil fuel markets – crude oil, natural gas, and coal – that is worthy of bringing to readers’ attention.
In Europe, the European Union’s 27 member countries have agreed to a revised proposal to cap the future price of natural gas to prevent huge price spikes as were experienced earlier this year. The cap will become effective on February 15, 2023.
Following last month’s announced cap price of €275 ($292) per megawatt-hour (MWh), which was termed a “joke” by some government officials, ministers agreed on a revised cap of €180 ($191)/MWh. The prior cap proposal required the price to be at the threshold level for 10 consecutive days before it would kick in. The new cap only needs a three-day duration to trigger it. The chart below shows when in the recent past the cap would have come into play.

Exhibit 14. How Europe Gas Prices Would Have Fared Last Year Under Price Cap SOURCE: Bloomberg
Other conditions may work to blunt the impact of the price cap. Prices must be €35 ($37)/MWh above an average of global liquefied natural gas prices for three days to be triggered. The cap applies to gas contracts bought and sold on all European trading hubs for one month, three months, and a year ahead terms. It is envisioned at some point over-the-counter deals may be included subject to review by the Brussels bureaucracy.
Not all EU members agreed with the new proposal, which suggests potential pitfalls when and if prices reach or exceed the cap. The various conditions that must be satisfied for the cap to be triggered make it likely it will not have much impact. We will see what the EU’s political climate is when gas prices near the cap.
U.S. Refining Operations:
The December Energy Indicators report of the Federal Reserve Bank of Dallas showed that the oil industry is making progress in boosting refinery outputs that are helping to lower gasoline and diesel pump prices, and possibly take some of the political heat off the industry. The latter comment is probably wishful thinking.
As the chart below shows, Gulf Coast refining inputs are near pre-pandemic highs, although inputs at refineries throughout the rest of the country are down. The latter is likely due to the closure of refineries that were judged uneconomic to operate or to justify upgrading capital expenditures. There have also been refinery accidents that have caused temporary shutdowns. The overall U.S. refining capacity will rise by 250,000 barrels per day when the ExxonMobil Baytown expansion begins operating in 2023.

Exhibit 15. U.S. Refining Industry Is Running At Peak Output To Boost Supplies SOURCE: Colorado Federal Reserve Bank of Dallas
When we examine refining margins it becomes clear that the peaks seen earlier this year are history. The decline in crude oil prices and gasoline demand has helped lower refining margins. Diesel/distillate demand remains strong heading into the winter heating season for New England, the Midwest, and Middle Atlantic regions who are the primary market for heating oil. Thus, distillate margins, although down from peak levels earlier, are still strong and greater than for gasoline.
The Fed made the point that the margins (in green) for U.S. Gulf Coast Mars fluidized catalytic cracker—refineries that are configured to produce higher shares of gasoline from a barrel of crude oil, showed larger declines than refiner margins (in yellow) for cokers which process heavier crude oils that tend to yield more diesel output. These trends are not surprising given the difference in market demand for the two fuels.
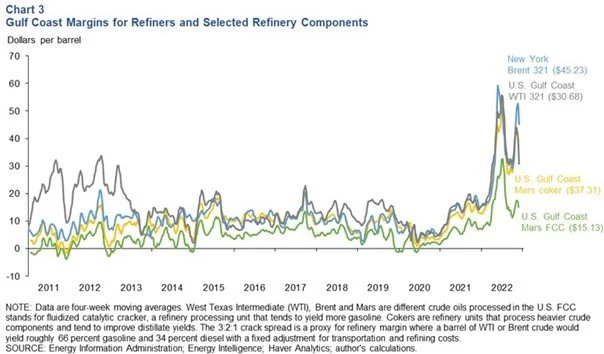
Exhibit 16. Refining Profit Margins Declining Although Diesel Margins Are Elevated SOURCE: Federal Reserve Bank of Dallas
As we are still early in the implementation phase of the western world’s ban on Russian oil purchases, it appears the action has not impacted global oil supplies appreciably. What remains to be seen is whether and by how much the global oil market may be upset when the refined product ban commencing in February goes into effect, especially for diesel, a prime Russian petroleum export. The next few months could prove very interesting for the global oil market.
IEA Coal Report Continues Demand View For Plateau
There is an old saying in forecasting that if you forecast the same outcome often enough, eventually you will be right. That may be the case for the International Energy Agency’s (IEA) outlook for coal as set forth in its latest report. Their forecast is essentially the same as last year. The IEA wrote:
In last year’s annual market report, Coal 2021, we said that global coal demand might well reach a new peak in 2022 or 2023 before plateauing thereafter. Despite the global energy crisis, our overall outlook remains unchanged this year, as various factors are offsetting each other.
Last year, the agency said that “a strong rebound in 2021 and slow growth thereafter lead to highest ever global coal demand by 2024.” And to back up that forecast, they produced the following chart with two graphs showing coal demand by country and region out to 2024 and detailing the cumulative regional changes between 2021 and 2024. It was not surprising to see the IEA focusing on coal’s growth in China, India, and Asia, while use is falling in the developed world of the United States and Europe. Those trends are well established.

Exhibit 17. How IEA Sees Coal Consumption By Region To 2024 SOURCE: IEA
The agency’s 2020 Coal report discussed how coal’s partial recovery was expected to fade after 2021. (Remember that each IEA coal report is published near the end of the year, so it has a good handle on demand for that year and the trends likely to impact the next several years.) In the 2020 report, the IEA pointed out how global coal consumption was estimated to have fallen by 7%, or by more than 500 million tons, between 2018 and 2020. They noted this two-year decline was “unprecedented in IEA records, which go back as far as 1971.”
Their forecast for 2021, based on a global economic recovery, was for global coal demand to rise by 2.6%, led by China, India, and Southeast Asia. The IEA cautioned that higher natural gas prices and electricity demand in 2021 would slow the “structural decline of coal use in the European Union and the United States, which both might see their coal consumption grow for the first time in nearly a decade.” While acknowledging that trends within regions would vary, the IEA said that “by 2025, global coal demand is forecast to flatten out at around 7.4 billion tons.”
As the chart in the 2020 Coal report’s Executive Summary showed, peak coal consumption of 8 billion tons was experienced in 2013 but it was in a downward trend subsequently with brief increases in 2017 and 2018, along with a small uptick predicted for 2021.

Exhibit 18. Record Global Coal Consumption Occurred In 2013 SOURCE: IEA
The IEA identified the right driving forces for coal demand, but it wildly underestimated the magnitude of growth. In 2021, coal demand rose by 6% rather than the IEA’s 2.6% growth forecast. As a result, global coal demand was over 7.9 billion tons. But the IEA’s forecast for 2025 still called for a “plateauing,” which seems to be their favorite word to describe its coal forecasts. It said the 2025 demand would be a record.
The following chart shows how the IEA sees global demand growing slightly between 2022 and 2025, with demand driven by China, India, and Asia, once again. But now the world is using 600 million tons more of coal annually than the IEA forecast as recently as 2020.

Exhibit 19. 2025 Will See New Global Coal Consumption Record - IEA SOURCE IEA
If you compare the 2021 and 2022 forecast charts, the 2025 demand projection of 8.038 billion tons of coal use would beat the projected record consumption forecast of 8.031 billion tons in 2024. Despite the rapid growth in renewable energy generation capacity, high natural gas prices, a reopened Chinese economy, and the ongoing energy crisis in Europe, the IEA may be forced to continue inching its future global coal consumption forecasts higher. For most countries, coal is an indigenous fuel, which means using more of it helps its economy through job creation and improved balance of trade balances.
Having read IEA coal reports since the mid-2010s, we always wonder how much its forecast is shaped by the agency’s commitment to the green energy revolution. Politicians are happy to pour billions into subsidies for wind and solar power even though little thought is given to the environmental damage mining the minerals needed to build those renewable energy generators will cause. Coal’s role in our global energy mix will remain despite the pressures to eliminate its carbon emissions contribution. We have made progress on that issue, with natural gas the most impactful near-term solution, while nuclear power is the preferred long-term replacement. We must make more progress.
Leveraging deep industry knowledge and experience, since its formation in 2003, PPHB has advised on more than 150 transactions exceeding $10 Billion in total value. PPHB advises in mergers & acquisitions, both sell-side and buy-side, raises institutional private equity and debt and offers debt and restructuring advisory services. The firm provides clients with proven investment banking partners, committed to the industry, and committed to success.
