

Energy Musings - December 13, 2022

Energy Musings contains articles and analyses dealing with important issues and developments within the energy industry, including historical perspective, with potentially significant implications for executives planning their companies’ future. While published every two weeks, events and travel may alter that schedule. I welcome your comments and observations. Allen Brooks
How Do We Know What Is Normal?
Falling oil prices are upsetting the conventional energy sector narrative as commodity and equity traders wrestle with what is normal, especially as they move to protect their gains of this year.
Enough Fingers For Power Market Finger-Pointing Exercise?
Inflation has become an issue for renewable providers, but so too has wind stillness, NOAA wind support vessel speed restrictions, ocean turbulence from wind farms, and mineral availability.
Random Energy Topics And Our Thoughts
Despite Fear Mongering There Is Good News On Climate Change
A Tough November For Energy Stocks But Good YTD Gains
Another Step In The EV Revolution
2022 Hurricane Season Was Not What Was Expected
How Do We Know What Is Normal?
As we approach the end of 2022, most people are issuing sighs of relief. Who would have thought on January 1, 2022, that we would be watching a war in Europe, a global energy crisis, a restructuring of the global petroleum industry, economic turmoil that may be taking multiple countries into serious recessions next year, a volatile stock market with serious losses for most investors, an unraveling of the tech industry bubble, a confusing election that leaves the U.S. as divided as before, and more? People are stressed out, and for those living in Europe with an ongoing energy crisis, their lives may be at risk from an extended period of cold weather. People want to return to normal. The problem is that no one knows what normal is any more. Is it the environment we lived in for the past two decades? Or maybe, it is the world we lived in back in the 1960s. Could it have been the 1980s and 1990s? No one knows, but everyone is struggling to figure it out.
The last decade was one of low energy costs, low inflation, low interest rates, low unemployment, and low economic growth. For the past several years, we have lived with a pandemic that upended our daily routines causing significant and potentially long-lasting economic and social harm, along with an unprecedented number of deaths from the Covid virus, but the basic economic and energy trends remained in place. If we could go back to the world of 2019, we suspect most people would be very happy. Is that likely to happen? We doubt it.
A recent day’s worth of media headlines from the U.K.’s Financial Times provide a glimpse of the state of our current economic and energy worlds. These headlines highlight some of the many challenges we are confronting. The headlines are taken from Wednesday, December 7, 2022, possibly an auspicious selection as it marked the 81st anniversary of Pearl Harbor and the start of World War II for the United States. Interestingly, we did not see articles about that day in any of the daily papers we read.
The headlines included:
U.S. unemployment rate set to surpass 5.5%, economists predict
Brent crude falls below $80 for first time since January
U.S. and U.K. pledge to maintain high level of LNG trade
Solar power expected to surpass coal in 5 years, IEA says
U.S. straightens out supply chains after months of inflationary snarls
“Workers need more than platitudes about ‘green jobs’” – Helen Thomas’s column
“The year Europe’s innocent worldview fell apart” – Janan Ganesh’s column
Mining magnate Andrew Forrest becomes Australia’s largest renewables player
Petrobras CEO to leave as Lula prepares to take office in Brazil
BlackRock chief Fink pressured to resign over ESG “hypocrisy”
KPMG staff cheated on professional tests, U.S. regulator says
DWS to lift dividend as asset manager battles greenwashing scandal
We could fill pages with headlines from other newspapers and media online sites for that day, but the above list shows just how widely the shifting sands of what we considered normal are changing and leading us into the “new normal.” But just as the ocean waves licking beaches are always moving the grains of sand and reshaping the beach, so too are the geopolitical, economic, social, and industrial waves reshaping our existing world.
On that same day, The Wall Street Journal carried a story titled “Oil Prices, Energy Stocks Diverge.” The article was trying to explain the divergence between oil prices, the lifeblood of industry activity and profits, and energy stock prices, which have soared this year, as we point out elsewhere in this newsletter. Two charts accompanied the article – one showing an index of the price of West Texas Intermediate (WTI) crude oil and S&P 500 index Energy stock prices, and the second showing the weekly speculative net positions in U.S. crude oil futures and options.
The following chart compares crude oil futures and energy stock prices for 2022. Note that the two measures closely followed each other for the first half of the year. However, in July, energy stocks began to move higher while crude oil prices continued to slide. More recently, as the decline in oil prices gained momentum, energy stock prices also began to fall. We suspect the recent retreat in energy stock prices was driven more by profit-taking by investors who had enjoyed nearly 70% gains than concern about the industry’s fundamentals.
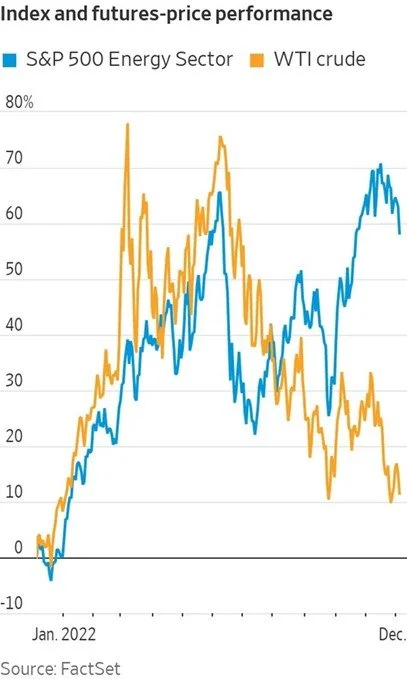
Exhibit 1. Recent Divergence Of Oil Prices And Energy Stocks SOURCE: The Wall Street Journal
Examining the data shows that after oil prices sank to a low point in late September, they rallied strongly in early October before trading down and then rallying back to their prior peak. From that point forward, prices began a steady slide that brought the price down to the earlier low point. If one looks at the recent three-month period, crude oil prices have been trading within a range.
For energy stocks, once they began to rally in July, weaker crude oil prices did not seem to deter them from climbing to new highs for the year. Their high coincided with the most recent crude oil price peak in early November. Since then, energy stocks have followed the downward trajectory of crude oil prices.
The Wall Street Journal writers interviewed various financial players trying to gain an understanding of what has caused such a divergent trading pattern. There were many views about why the divergence, but the recent stock price decline was explained by deteriorating industry fundamentals (falling oil prices) and how lower oil prices help the fortunes of other stock sectors, so relative performance may switch. The huge energy gains also justified the switch.
According to Paul Hickey, co-founder of Bespoke Investment Group, a stock market analysis firm, when the energy industry was in a strong upswing starting in late 2006, the S&P 500 energy stock sector rose 26.8% over the next 12 months while oil prices jumped 69%. But like other periods when oil and energy stocks surged, the stocks had not seen any period with two-year rolling returns that Bespoke said reached 227% this November. “This pace of gains for a sector can’t last forever, especially when one of the key commodities driving its profits has been declining,” said Mr. Hickey.
What is interesting is what has happened to crude oil futures prices and trading, which may help explain the weaker oil prices. The chart on the next page shows the weekly speculative net positions of commodity traders in U.S. crude oil futures and options beginning in early February and ending the last week of November. What this chart shows is a high level of positions held during the first part of the year compared with a much lower level for the balance of the year.
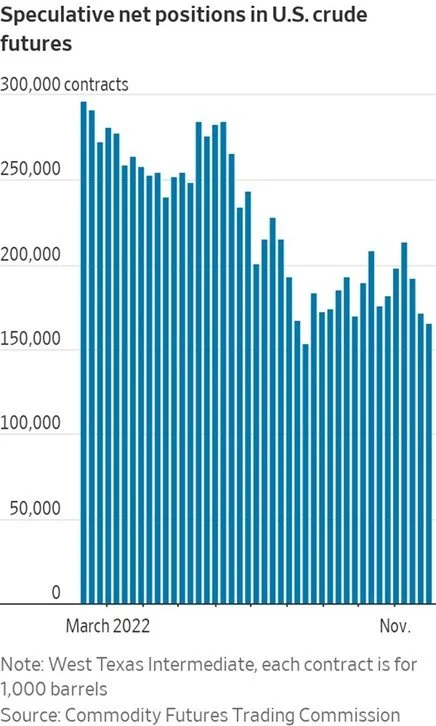
Exhibit 2. The Emerging Liquidity Challenge For Crude Oil Trading SOURCE: The Wall Street Journal
Dissecting the weekly data, we note a relationship between crude oil futures prices and traders’ net positions. On January 3rd, crude oil futures were trading at $76.08 a barrel on their way to $80.20 on February 1st. On July 1st, oil futures were trading at $108.43, down from their peak of $122.11 on June 8th. Trading crude oil futures and being long futures positions was a very profitable strategy during the first half of 2022. Go with the momentum proved a successful trading approach.
As crude oil futures prices were peaking, talk amongst G7 finance ministers, led by U.S. Treasury Secretary Janet Yellen, centered on what additional economic and financial sanctions could be brought against Russia to punish it for its invasion of Ukraine in late February. An idea floated in mid-May by Yellen was some form of a price cap on Russian oil to reduce the country’s income from oil exports that were financing its war efforts. The European Union was discussing a ban on purchases of Russian oil and refined products, which was embraced by the United States. In mid-June, ahead of the G7 Finance Ministers meeting, Yellen offered a more fully developed concept for a Russian oil price cap. Widespread media reports of this proposal coincided with the first major drop in traders’ futures contract positions.
Traders were reacting to the unknown prospects for a government-imposed cap on Russian oil prices – likely well below the then-current oil price – that could sap value from future oil prices when the cap went into effect. This fear directly impacted traders’ views of future oil prices and the possibility of serious global oil market disruptions. Many traders may not have wanted to wrestle with these uncertainties. Additionally, oil prices had already climbed about 43% in 2022, providing strong crude oil trading profits as well as significant returns for energy stock traders. For some traders, being able to book a 40+% return in half a year made them more cautious about risking capital without a better understanding of what government actions might be taken that could disrupt the market. As the saying goes on Wall Street, you do not get penalized for taking a profit, especially a hefty one.
There were other considerations, too. Inflation was raging and central banks were raising short-term interest rates to slow economic activity that these banking officials perceived was driving the inflation. Those actions were ammunition for forecasters to predict moderating economic activity and even a future recession. Remember, it was during the early summer that the United States reported its second consecutive quarter of negative gross domestic product growth, meeting the standard definition of a recession. Recessions mean less oil demand and a weakening of oil prices. Additionally, the Biden administration began weaponizing the U.S. Strategic Petroleum Reserve’s oil supply by releasing one million barrels a day for the next six months to lower gasoline pump prices. All these developments cemented a less optimistic outlook for energy demand and prices. The result was that oil traders went from average weekly trading positions of nearly 250,000 contracts in the first half of 2022 to about 165,000 on average during the second half, a one-third reduction in commitments.
Higher interest rates were weighing on traders’ cost of capital needed to support their trading operations. An aggressive Federal Reserve Board hiking interest rates and talking about the need for them to go much higher and possibly stay elevated well into 2023 also colored traders’ willingness to risk capital. Liquidity throughout the capital markets began contracting, which further increased trading risk. Again, these pressures and concerns came at a time when traders were sitting on hefty profits, so taking money off the table became an easy decision.
There has been a significant retreat in global crude oil markets as European governments work to cut energy demand in their economies. Slowing economic activity in response to higher interest rates and inflationary impacts are beginning to take a toll on consumer spending and job growth leading to increased odds for a recession in 2023. How severe a recession may be debatable, but its growing probability reduces bullishness for higher oil prices in the near term.
The Russian oil price cap, set at $60 a barrel, is proving less disruptive because the price was about or even higher than what its oil had been trading at. Other sanction provisions impacting the financing, insuring, and shipping of Russian oil have created some disruption to the global oil market, but so far not to the degree many observers expected. The most important disruption has been the additional days that Russian oil will spend in transit to its current and new customers. Since the ban on the purchase of Russian refined petroleum products does not come into effect until February 5, 2023, much of the winter oil demand increase should be met with existing producer output. As a result, the eyes of oil traders are firmly on estimates of oil demand later in 2023 if a recession occurs.
For the remaining few weeks of 2022, barring some dramatic economic or geopolitical event, oil prices will likely remain in a trading range about where they are currently - $75 a barrel for WTI. When the calendar turns and ushers in 2023, financial players have clean slates. Their performance for 2022 will be marveled at, but the investment question quickly shifts to “what are you going to do this year?” That is where many of those headlines we quoted earlier will become important. What will Europe’s winter be like? Will energy supplies be disrupted more than currently anticipated? Could economic activity in Europe and North America fall into an abyss with a significant negative impact on oil demand? But, if a severe recession emerges, how quickly will central banks move to cut interest rates to prop up economies, suddenly boosting economic activity and energy demand? Will Russia use the winter months to further weaponize its energy resources to inflict serious economic and social pain on Europe?
Those economic questions do not even touch issues such as policymakers’ moves regarding energy security versus carbon emissions. Will the emerging shift by leading financial players – BlackRock and Vanguard – away from rigid net zero carbon mandates for corporations continue, or maybe even accelerate? That might happen even as the corporate world continues embracing a lower-carbon world and the need to invest to help fulfill that strategy.
One of the most important questions for 2023 will be whether those climate activists leading the effort to shut down the fossil fuel industry become cheerleaders for the massive mining activity their green energy policies require. Inflation in the renewable energy sector is emerging and given the magnitude of minerals necessary to meet the sector’s projected demand, prices will only go higher. Will the public be willing to continue massive subsidies to help these producers? How will rising green energy costs impact overall inflation, and how will governments and central banks deal with the issue? Many questions, but few answers. They will need to be addressed next year, thus energy will continue to “live in interesting times.”
Enough Fingers For Power Market Finger-Pointing Exercise?
For much of 2022, oil and gas companies have been the target of outrage over gasoline, diesel, and natural gas prices as well as “obscene” profits. That outrage is suddenly shifting to renewable energy as many supporters are befuddled by the sudden change in their cost trend along with their continuing performance issues. The past few weeks have seen a cornucopia of news stories highlighting the problems for renewables and the exasperation of executives about how to fix them.
Our first example coincided with Germany’s Siemens Energy presenting its fiscal 2022 earnings results in mid-November. The company said its adjusted earnings before interest, taxes, and amortization (EBITA), along with special items, had fallen to €379 ($394) million compared to €661 ($687) million for its 2021 fiscal year. The company stated that its “overall performance” had been “held back by the negative development at Siemens Gamesa Renewable Energy (SGRE),” a wind turbine manufacturer in which it has majority ownership. “While Gas and Power benefited from its turnaround plan and saw adjusted EBITA rise sharply, the increase was more than offset by a wider loss at SGRE,” according to the company. This was “due to difficulties in the ramp-up of the 5.X onshore platform as well as supply chain delays.” Siemens Energy’s net loss in FY2022 increased to a €647 ($672) million from €560 ($582) in the prior year. The company did report a record order backlog of €97.4 ($101.2) million. For Siemens Energy investors, the results were not only disappointing, but they were financially costly as management “will suggest to the Supervisory Board not to propose a dividend for 2022.”
At the root of the problem has been inflation. Siemens Energy CEO Christian Bruch told CNBC’s Squawk Box Europe, “Never forget, renewables like wind roughly, roughly, need 10 times the material [compared to] what conventional technologies need.” Bruch went on to say, “So, if you have problems on the supply chain, it hits … wind extremely hard, and this is what we see.”
For much of 2022, supply chains have been the explanation de jour for renewable energy companies struggling with deteriorating economics for their businesses. Other renewable energy executives, especially those dealing with offshore wind projects on the U.S. East Coast, have begun pointing their fingers at rising interest rates as an additional profit challenge. Remember Avangrid officials cited rising interest rates as well as overall inflation for the need to ask Connecticut and Massachusetts utilities to make an “adjustment” to the prices already agreed to for the electricity from their offshore wind farms. The irony grows because now, Avangrid’s Connecticut electric utility, United Illuminating (UI), is blaming generators for rising power prices.
A recent article in CT Examiner says that the public’s outrage at the upcoming hike in Connecticut electricity bills is misdirected because power generators are allowed to operate with little scrutiny. By implication, these power generators are reaping obscene profits. Connecticut residents paid the highest electricity bills outside of Hawaii in 2021. They are now facing 40-50% hikes in electricity prices starting January 1, 2023. The explanation from utility executives and regulators that the price hikes are merely companies passing along higher power prices has not placated Connecticut ratepayers.
Catherine Stempien, President and CEO of Avangrid Networks, UI’s owner, said that rate increases are hitting everyone in New England’s deregulated electricity market, regardless of how their state procures electricity. Some states handle the procurement of electricity, but in Connecticut, the utilities participate in an auction overseen by the state’s Public Utility Regulatory Authority (PURA) and its Office of Consumer Counsel. She said what is lacking is transparency into the generators’ costs. So, when generators say they are just passing along the cost of fuel or recovering other costs, nobody knows if that is true. In contrast, Stempien notes that every line item in UI’s financials is subject to review by PURA. She later commented that when utilities owned their power plants before Connecticut’s electricity deregulation move in 1998, PURA had the same level of scrutiny over how much they spent on generation.
According to Stempien, utilities operating in an unregulated power market are being taken advantage of by generators from whom the electricity is purchased. We wonder if Stempien would be happy for her sister company Avangrid Renewables to open its books up to the public for its offshore wind projects and other renewable energy facilities. Maybe the public would like to see just how much the Production Tax Credit for wind power is adding to the profits of Avangrid Renewables. Stempien seems to be arguing that the electricity system in Connecticut needs to be revised and returned to full regulation, a call we are starting to see in other states.
But a new issue for wind has suddenly arisen in Europe – low wind speeds. Remember that wind stillness last summer and early fall is what initially kicked off the explosive rise in natural gas prices that was further pushed up by Russia’s invasion of Ukraine. Higher gas prices were the direct result of high-pressure weather systems parking themselves over western Europe for weeks, resulting in low winds and low wind-generated electricity forcing utilities to find alternative power, often from gas-fired generators. While hotly debated last year, European Union countries continue to wean themselves from fossil fuels, especially shunning the energy supplies coming from enemy Russia, and replacing them with power generated from wind and solar.
We have written about this problem before when low wind speeds were blamed for boosting European natural gas prices as that fuel was powering generators needed to offset the lost wind output. Eventually, with the Russia/Ukraine war raging and Soviet fuel supplies shrinking, governments worked overtime to find alternative energy supplies. Unfortunately, these supplies were expensive forcing governments to implement schemes to try to mitigate the financial pain their citizens were experiencing. Elimination of environmental taxes, subsidies to producers, rules for reduced energy consumption, windfall profits taxes on generators, and direct subsidies to homeowners were just some of the steps that governments took to ease the pain of sky-high energy and utility bills. While high energy prices remain an issue and carbon emissions are rising, European governments continue to push for more renewable power as their long-term energy solution. In most cases, this has meant increased commitments for wind power.
The Wall Street Journal carried an article titled “Lack of Wind Pushes Up Prices.” In it, they pointed out that wind speeds during the last days of November and early days of December measured at Hamburg, Germany, fell to around five meters per second, the equivalent of 11 miles per hour. That is the minimum wind speed to generate power from wind turbines. According to windy.com, wind speeds of around 15 meters per second or 33 miles per hour are needed to produce maximum power generation.
The writer of the article interviewed Evangeline Cookson, a meteorologist and research analyst at Marex Spectron, who said such wind speed anomalies are not particularly unusual but coming when governments are trying to avoid higher utility prices, it is not helpful. Cookson also pointed out that the ideal situation for European wind energy is for low-pressure winds flowing in a westerly direction over northern Germany and France. That is because that is where the highest concentration of wind turbines in Europe is installed. However, the region has been experiencing the exact opposite condition recently as high-pressure weather patterns are bringing weak, north-easterly winds and thus low power output.
We track the daily wind energy in Europe via the website WindEurope.org. After reading The Wall Street Journal article, we went back to look at the daily wind energy data. As we have written about, wind speeds vary hourly during the day, as well as seasonally. Wind speeds in Europe and elsewhere are known to also vary cyclically over long periods.
As we reviewed the most recent wind power generation data, we thought we would do a quick comparison with last year. Unfortunately, the archive data on the website is not complete. We were limited to comparing data for the respective years from November 18 to December 2. While not as long a dataset as we would have liked, as you will see, the comparison highlights the variability over time and between years. It also demonstrates the problem cited by the newspaper article.
We prepared three charts from the website’s data. The first chart shows the overall electricity generated from wind in Europe for the respective 2021 and 2022 time periods, as well as the percentage that output represented of total electricity demand. The second and third charts show similar data comparisons for onshore and offshore wind separately for the years and time periods.

Exhibit 3. Europe’s Wind Energy Can Fluctuate Significantly SOURCE: WindEurope.com
If we focus on 2021 (blue columns), total wind output was healthy on November 18 and 19. It then fell the next two days and remained low until November 29. On November 30 and the first two days in December, wind output was very strong. That pattern of wind output was reflected in the share of total electricity demand for that period.
In contrast, in 2022 (orange columns) wind produced a bonanza of electricity on November 22-23 relative to the previous four days. From its peak on November 22, daily wind output steadily declined to November 30, except for November 27-28. The November low fell in the middle of three days of low wind output (November 29 – December 1). This extremely low wind output period was what sparked The Wall Street Journal article.

Exhibit 4. While Still Variable, Onshore Wind Showed Less Dramatic Shifts SOURCE: WindEurope.com

Exhibit 5. Offshore Wind Was More Erratic Than Onshore Wind SOURCE: WindEurope.com
The charts for onshore and offshore wind volumes show similar patterns as for total wind power output. We were shocked at how low the offshore wind output was from November 29 to December 1, given the amount of money Europe has been pouring into building offshore wind farms. Offshore wind’s share of total electricity demand was below 1% on those three days!
Although the periods we studied are short, the data capture wind generation’s volatility during those days in both 2021 and 2022. Based on other more extensive wind data, we know that wind speeds in Europe tend to be cyclical. As a result, we have always wondered how much research was conducted into the history of wind speeds before governments committed to depending so much on wind energy. Is it possible that policymakers were blinded by the prospect of unlimited free, carbonless fuel for countries committing to reach net zero carbon emissions?
We are also learning of other issues with wind energy including the warming impact on earth surfaces around the turbines as well as bird deaths and noise pollution, but we are not exploring them in this article. We will look at the two newest issues for offshore wind farms. These include new rules being considered or implemented to protect right whales in the waters off New England and whales and other marine mammals in the West Coast areas where offshore wind lease sales were recently conducted. The second issue relates to recent studies about the impact of wind turbines on marine animals, the waters, and ocean floor not just around the turbines but also over larger neighboring areas.
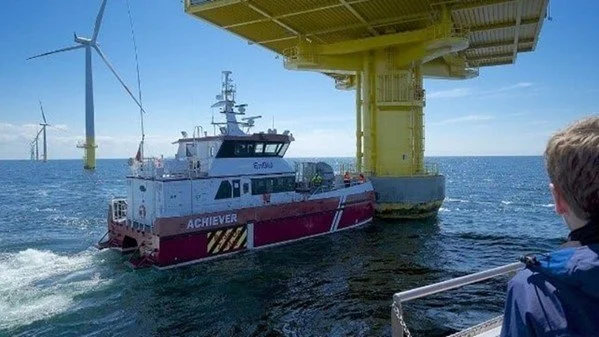
Exhibit 6. A Wind Farm CTV That May Have Its Speed Limited By NOAA SOURCE: Maritime Executive
Developers of wind farms off the New England coast are growing concerned about the National Oceanic and Atmospheric Administration’s (NOAA) planned vessel speed limit rules to help protect the North Atlantic right whales. The speed limits would impact wind farm capital expenditures and their operating expense. Maintenance work for wind farms is generally conducted using the industry-standard crew transfer vessel (CTV) that operates as a day-boat. Even at a speed of 20 knots per hour, the CTV is limited in its range. If the speed limit is lowered to 10 knots, the vessel’s range would be cut in half, necessitating the wind farm developer to switch to using a more expensive service operations vessel (SOV) impacting expense and forcing the marine industry to construct more Jones Act-compliant SOVs.
NOAA’s plans are driven by its responsibility to protect the North American right whale population. These whales were heavily harvested by whalers in the 19th century. The population has never fully recovered and has been in decline for years. Right whales are now critically endangered with an estimate of only 364 left with the key to the population’s future the viability of its 88 female whales. The two major threats to the right whale population’s survival are lobster/crab pot lines and ship strikes. NOAA’s proposed rules would address the latter risk.
NOAA currently has a 10-knot vessel speed limit in effect for larger vessels in two seasonal management areas, one in the northeast and another in the southeast regions of the Atlantic Ocean. CTVs under 65 feet in length are not subject to the speed limit. However, a recent NOAA study found that small vessel strikes at high speed can be lethal for right whales.
The offshore wind industry business model is keyed to CTVs operating at speeds of 22-29 knots, which would be seriously upended if a 10-knot speed limit were imposed. Claire Richer, offshore wind director for American Clean Power, speaking on a panel at the WorkBoat Show, said, "That has huge cost implications for the offshore wind industry. One of the first kind of decisions you make with your project when it comes to vessels is if you're going to be CTV-based or SOV-based and going 10 knots doubles the amount of time that you're transiting." She lamented that "What's killing us the most is that there's no innovative way to go 10 knots." Her organization and wind farm developers are pushing the use of new technologies to protect right whales rather than “a blanket 10 knots” mandate.
Two technologies identified in an article in Maritime Executive are computer-vision technology to watch out for whales at long distances, giving crews early warning, and artificial intelligence to identify whales. Charles River Analytics, the developer of the computer-vision technology, claims it can accurately detect whales about 80% of the time and ships 90% of the time. Spotting whales allows vessels to take action to minimize any harm.
The artificial intelligence technology comes from Canadian startup Whale Seeker which is seeking to test out its technology to detect marine species. Its artificial intelligence tool is trained to identify marine mammals from aerial photographs that create multiple datasets. The technology is trained to identify the outline of a whale apart from other surface visuals.
While these technologies may be important, NOAA, as a government agency, will need to study them before incorporating them into rules for protecting whales and other marine mammals. What NOAA knows is that limiting the speed of vessels in areas where right whales are known to exist is the safest step. We are not aware of proposals from wind farm operators for a permitting system like the one allowing U.S. wind turbines to kill (“incidental take”) up to 4,200 eagles over a 30-year time frame. The number of eagles that can be killed increased in 2016 from 1,000 over five years to 4,200 over 30 years. The wind turbine owner pays a fee for the permit as well as additional fees for five-year reviews and renewals. The permit system was changed to provide wind farm developers with longer-term certainty for such projects. Without a permit, the fines can be substantial.
According to the Property and Environment Research Center:
In early 2022, the federal government fined electric utility NextEra Energy $8 million for killing 150 eagles over the past decade at wind farms owned by the company in eight states. In 2013, Duke Energy agreed to pay a fine of $1 million, as well as $900,000 in restitution and compensatory mitigation, in a settlement for killing 14 eagles and 149 other protected birds at two wind farms in southeastern Wyoming between 2009 and 2013. In 2014, PacifiCorp was fined $2.5 million for killing 38 golden eagles and hundreds of other protected birds at its wind farms in Wyoming.
The current fee for a permit is $36,000 with $8,000 for every 5-year renewal. Given these fees, it is difficult to understand why major utilities would not secure a permit understanding the magnitude of the fines levied on companies convicted of illegal eagle killings or injuries.
The latest problem for offshore wind farms comes from a new peer-reviewed paper examining their impact on marine ecosystems. According to the German scientists who conducted the study, most examinations of the impact of wind turbines on marine ecosystems have involved single wind turbines. As more and larger offshore wind farms are constructed, there are questions about their impacts not only on the area immediately under them but also on adjacent areas.
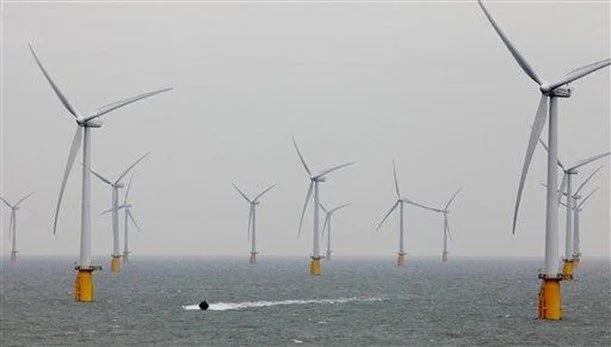
Exhibit 7. Offshore North Sea Wind Farm SOURCE: Townhall.com
The study examined the North Sea where numerous large wind farms have been and are continuing to be installed. The study relied on modeling and simulations seeking an understanding of the "systematic, large-scale, time-integrated response of the ocean to large OWF [offshore wind farm] clusters." According to the study’s summary, the researchers reported that "results provide evidence that the ongoing offshore wind farm developments can have a substantial impact on the structuring of coastal marine ecosystems on basin scales." The latter observation – basin scale – is particularly interesting, as it suggests that adding hundreds and eventually thousands of offshore wind turbines, as envisioned by various governments including the United States, could produce outcomes that are less than desirable and contrary to the current benign assumptions.
The scientists explained what they found:
The wind wake effect of offshore wind farms affects the hydrodynamical conditions in the ocean, which has been hypothesized to impact marine primary production. So far only little is known about the ecosystem response to wind wakes under the premises of large offshore wind farm clusters. Here we show, via numerical modeling, that the associated wind wakes in the North Sea provoke large-scale changes in annual primary production with local changes of up to ±10% not only at the offshore wind farm clusters, but also distributed over a wider region. The model also projects an increase in sediment carbon in deeper areas of the southern North Sea due to reduced current velocities and decreased dissolved oxygen inside an area with already low oxygen concentration.
The scientists also observed:
In addition to impacts on the regional atmosphere, multiple physical, biological, and chemical impacts on the marine system have been identified. The underwater structures, such as foundations and piles may cause turbulent current wakes, which impact circulation, stratification, mixing, and sediment resuspension. Most studies conclude that the direct hydrodynamic consequences of the wind farm structures are mainly restricted to the area within the wind farms. However, some speculate also, that the cumulative impacts of an increasing number of offshore installations might result in substantial impacts on the larger scale stratification. Larger scale effects of offshore wind energy production, well beyond the wind farm areas, are introduced to the atmosphere by infrastructures above the sea level and the energy extraction itself. Atmospheric wakes appearing in the lee of wind farms extend on scales up to 65 km and beyond, depending on atmospheric stability, with a wind speed reduction of up to 43% inside the wakes leading to upwelling and downwelling dipoles in the ocean beneath.
We doubt that this past spring when offshore wind developers paid $4.4 billion in lease bonuses to secure tracts off New York Harbor to build wind farms they would be facing as many problems and challenges as they are. Those challenges are not about to be easily resolved. The economics of building renewable energy-generating facilities are changing.
The conventional view that renewable energy costs only go down has been overturned as their costs have increased this year and are projected to increase next year, too. Cost forecasts for the future hope for a return to the downward trend of the past, but global economic and market conditions are sharply different. The huge expansion in renewable energy is straining the supply of critical materials. Lithium, a critical material for batteries and generating electricity, was in oversupply for many of the past 10 years, which contributed to the decline in its price. Now, lithium is in short supply and prices have reached a record of $85,000 per ton, up fourfold since September 2021.
People are upset about the cost of energy, having enjoyed low prices for decades. Energy is involved in every aspect of modern life and its elevated price will filter through the rest of our economy helping drive up inflation. Higher interest rates, something utility companies are now pointing to as a cause of some of their problems will also not return to the zero-interest rate environment of the past decade. These conditions will create many challenges going forward for energy and utilities.
Random Energy Topics And Our Thoughts
Despite Fear Mongering There Is Good News On Climate Change
The United Nations Framework Convention on Climate Change recently completed its 27th Conference of the Parties (COP27) in Sharm el-Sheikh, Egypt. U.N. Secretary-General António Guterres addressed the opening session and warned the delegates that “We are on a highway to climate hell with our foot still on the accelerator.” He went on to admonish the audience for failing to transition the global energy system to a carbon-free one fast enough to avoid a climate disaster and that they needed to accelerate their efforts.
Depending on who you listened to or read critiquing the conference’s outcome, it was either a disaster because fossil fuels were not completely shut down or it was a historic success for creating a “loss and damage” fund to transfer money from wealthy countries to poor nations struggling to finance the development of green energy systems. We covered some of the conference discussions in our last Energy Musings issue. However, recently, in contrast to the climate disaster hysteria, climate scientist Roger Pielke, Jr. blogged about the good news for the climate, which, as far as we can tell has received scant attention.
Pielke’s most recent blog followed an earlier one that highlighted his recent presentation at the International Institute for Applied Systems Analysis 2022 Scenarios Forum in Vienna, Austria. Pielke currently is on a sabbatical from teaching at the University of Colorado, Boulder, and is conducting extensive collaborative research on climate scenarios and disaster estimations. He has also been blogging a lot about the climate misinformation being spread by U.S. government reports, officials with the U.N. International Panel for Climate Change (IPCC), and various media publications.
In his blog, Pielke presented the latest estimate (2022) of carbon emissions from the Global Carbon Project. The chart below shows that data. It also shows a wide array of climate scenarios besides historical data points of total fossil fuel CO2 emissions (black dots). The 2022 estimated CO2 data point is shown in a red dot. The four primary climate scenarios extending to 2050 that have been utilized by the IPCC – RCP2.6, RCP4.5, RCP6.0, and RCP8.5 – are also shown in the chart. These scenarios reflect CO2 emissions projections, and the resulting global temperature increases from the historical average for 1850-1900, as presented in the IPCC’s Climate Change 2014 (AR5) report. Those scenarios were renamed, and additional scenarios were added to the Climate Change 2021 (AR6) report issued a year ago.
These climate change scenarios are based on different estimates of the radiative forcing expected to be experienced in 2100. The RCP4.5 scenario assumes the forcing will be 4.5 watts per meter squared (4.5 W/m^2).
Following AR5’s release in 2014, many climate scientists, IPCC officials, climate activists, and the media embraced RCP8.5 as the “business as usual” scenario for the global economy. This scenario produces catastrophic climate outcomes because it relies on immense amounts of coal to be used and a retreat from pollution abatement efforts currently underway, with no new ones introduced. The scenario is acknowledged to be so extreme that the U.N. has acknowledged the scenario is unrealistic and unlikely to ever happen. The primary reason it will not happen is the physical limitation for mining the volumes of coal necessary to power the projected number of generating plants. That disclaimer, however, has had little impact on those promoting the “worst case” climate outcomes unless the world immediately ceases using fossil fuels to power the economy.

Exhibit 8. How CO2 Emissions Are Tracking Successful RCP4.5 Climate Model SOURCE: Roger Pielke, Jr.
In AR6, the IPCC acknowledged that RCP4.5 (renamed SSP2-4.5) was the outcome of the most-likely emissions scenario in its technical report, but not in the Summary for Policymakers volume. While this scenario resulted in a narrowing of the range for projected surface temperature increases in 2100, the primary scenario referenced in the discussion was the worst-case scenario. Under the new SSP2-4.5 scenario, the best estimate calls for a temperature increase of 2.7ºC, within a range of 2.1ºC to 3.5ºC. Already, according to the IPCC, the world has experienced a 0.85ºC warming. The best guess and range of temperature increases projected in this project are listed below.

As the chart showed, carbon emissions driving temperature changes had once been on track for the RCP8.5 scenario, they are now firmly on the RCP4.5 scenario projection. That is certainly good news for our climate outlook.
More significantly, Pielke presented a second chart that reinforces the progress the planet is making in meeting climate change demands. The significance of this chart is the statement it makes about following or bettering the RCP4.5 trajectory. This scenario has been widely used in academic climate literature and by the U.S. National Climate Assessment (NCA) to indicate a future where climate policy is considered a success. The endorsement of this view has continued as it is expressed in the latest draft of the next U.S. NCA report. In other words, SSP2-4.5 is viewed as at the upper end of the evolution of global CO2 emissions, at least for the foreseeable future.
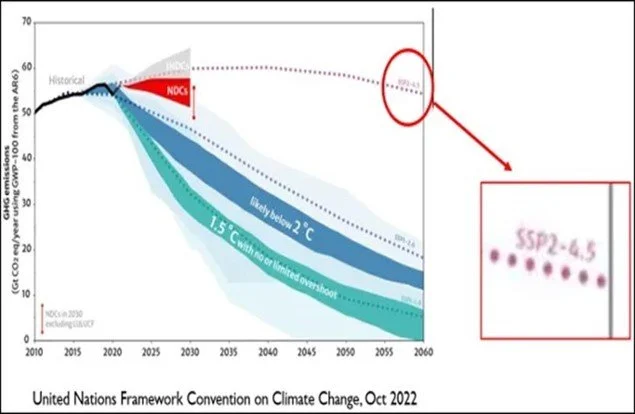
Exhibit 9. Carbon Emissions Projections Under “Successful” Climate Change Model SOURCE: Roger Pielke, Jr.
Pielke’s second chart (above) is a graph from the U.N. Framework Convention on Climate Change showing projected global greenhouse gas emissions, including CO2, to 2030 as the red wedge. The graph shows that the entire red wedge falls below the projected path for SSP2-4.5.
We suspect the reason this chart has not received attention is that it refutes the disaster narrative needed to justify harsh climate change policies and actions such as the “loss and damage” fund. We and Pielke would acknowledge that there is nothing sacred about climate models and reality, so we may deviate from the currently projected model. There is also the possibility that given this news, people would become complaisant about sustaining existing actions to reduce carbon emissions and planned projects to cut them further. After acknowledging all those risks, giving the world some good news about cleaning up the world’s climate would be welcomed as it might spur increased support for continuing the effort.
A Tough November For Energy Stocks But Good YTD Gains
An inflation measure reported during November suggested the economy had passed the peak rate and was in a slowing inflationary environment. That was translated by investors into the belief that the Federal Reserve Board would slow the rate of monthly interest rate hikes it had been telegraphing and possibly stop raising rates early in 2023. Such a move would likely head off a major recession next year, and possibly even avoid one entirely. This scenario was judged to have a high likelihood, which caused investors to rush into the stock market to buy stocks. Surprisingly, some of the stock market sectors one would have thought would be major beneficiaries from a near-term peaking in interest rates and lower inflation did not participate in the overall market advance in November. Energy, because of its dynamics, did suffer during the month.
As the chart below shows, the S&P 500 index posted a 5.6% gain for the month. Materials, the best-performing sector for the month, advanced 11.8%. None of the 11 market sectors declined in November, with Consumer Durables posting the worst performance only rising 1.0%. Energy posted the second-worst performance with a 1.3% gain.
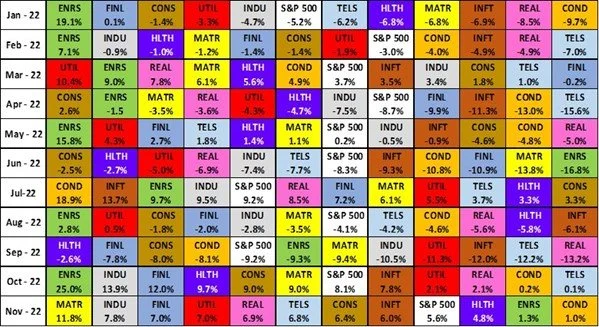
Exhibit 10. Energy’s Second-to-Last Performance Has Not Hurt Its Outstanding 2022 Gain SOURCE: S&P, PPHB
This second-worst performance marked only the second time that Energy was at or near the bottom of sector performance during the first 11 months of 2022. In June, Energy declined 16.8% for the month, landing in last place. In September, Energy declined 9.3% put landed in the middle of the ranking of monthly sector performance. Otherwise, Energy finished the other months of 2022 in first, second, or third place. This record has led to Energy leading the year-to-date sector performance with an increase of 70.7%. Energy was one of only three sectors that have posted gains for 2022, with Consumer Staples rising 2.3% and Utilities up 2.1%. So far, this year has been dismal for equity investors as the S&P 500 has fallen 13.1%.
The chart below shows the relative price performance for 2022 for all sectors of the S&P 500 index and the overall index. This chart includes the first day of December, so it does not match the data we reported through the end of November. Because December 1st was a down day on Wall Street, the year-to-date S&P 500 index in this chart shows a negative 14.5% performance compared to only a 13.1% decline through November 30. The chart shows Energy was up only 63.5% and was the only positive sector so far for 2022. The other two positive sectors through November 30 shown above – Consumer Staples and Utilities - fell into cumulative negative territory after the market’s decline of December 1st was included.

Exhibit 11. 2022 Stock Market Performance Has Been All About Energy SOURCE: Yardeni Research
What we know about Energy stocks and their performance is that they are tied to the outlook for energy markets, most identified with the price of oil. High oil prices signal increased profits for energy companies and thus their stocks should be worth more. That view must incorporate the view that these elevated oil prices will continue in the future. Thus, changes in oil prices can cause Energy stocks to rise and fall, although they are also subject to general stock market sentiments.
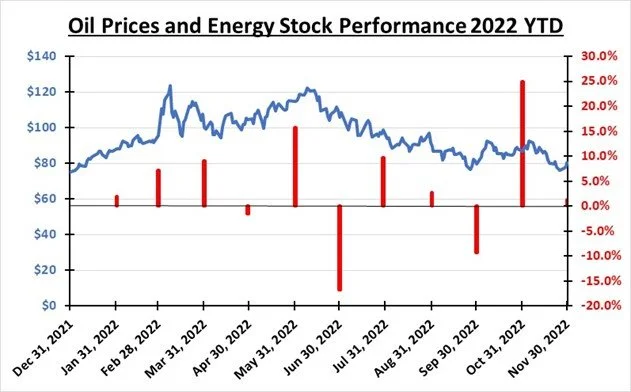
Exhibit 12. Energy Stocks Have Tracked Oil Price Moves SOURCE: EIA, S&P, PPHB
The chart above shows the daily price of West Texas Intermediate crude oil futures and the monthly performance of the S&P 500 index’s Energy sector. We can see how the general trend in oil prices drove the monthly performance of Energy stocks. As oil prices rose steadily into early June, Energy stocks rose along with prices. They dropped sharply in June when oil prices peaked and began falling. Stock performance declined and turned negative in September as oil prices slid. The huge positive performance of Energy stocks in October reflected improving oil prices, prospects for the re-opening of China with its huge oil demand, and prospects that the U.S. economy would escape a recession. The sharp drop in oil prices, growing concern about a recession, and bad China Covid-19 shutdown news contributed to weak Energy stock performance in November. The outlook for this triumvirate of factors will have a lot to say about the future performance of Energy stocks as we finish 2022.
Another Step In The EV Revolution
The iconic American Automobile Association (AAA) just announced it is launching a second, larger-scale program for mobile electric vehicle (EV) charging to members in 14 U.S. metropolitan areas. The new program builds on AAA’s experience with a decade-old mobile EV charging program. The cities are displayed on the map on the next page.
The AAA’s original mobile charging program began almost with the start of the EV expansion in the U.S. and is in keeping with its history. Despite there being only 23,000 cars in the U.S. in 1902 compared to 17 million horses, 50 small motor clubs had been formed by automobile enthusiasts across the country. Nine of those clubs came together in Chicago to form the AAA.
The 2010 pilot mobile charging program included five prototype mobile-charging vehicles, which have now been retired. Based on their learnings, a new pilot program has emerged. In 2016, AAA reported that its mobile-charging service was rarely being used as EV owners seemed to have a handle on their range and charging needs. While some would say that EV owners had mastered their range anxiety, the reality, as reported by the Department of Energy, is that 80% of EV charging is done at home overnight. The AAA service is more for those EVs that run out of charge from overestimating their battery charge range or experiencing trouble finding public charging stations or they are inoperable. The AAA mobile-charging service is much like its normal roadside service with battery charges or flat tire changing.
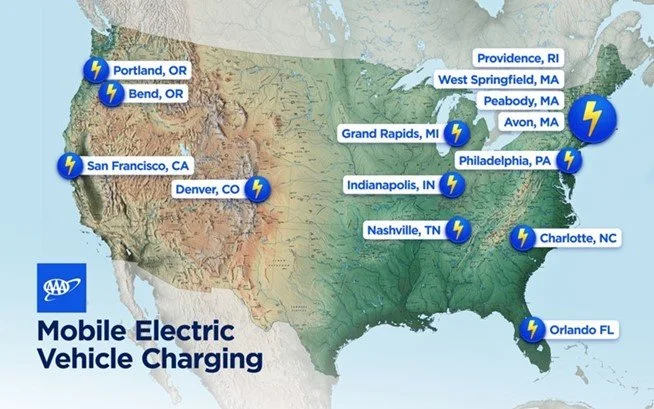
Exhibit 13. Cities Where The New AAA Mobile-Charging Service Will Be Available SOURCE: AAA
It is noteworthy that AAA is integrating EV charging options with its trip-planning tools. AAA said it will soon be adding EV-specific features to its newly launched Trip Canvas road-trip planner as well as listing charging stations alongside gasoline stations in the TripTik Travel Planner. EV charging locations were first added to its map services in 2012. For a 120-year-old organization, AAA has been on top of the EV revolution for years.
2022 Hurricane Season Was Not What Was Expected
“It’s tough to make predictions, especially about the future,” is a quotation attributed to Yankee great Yogi Berra. There are other guidelines for those of us who have been (still are?) in the forecasting business – never give a price and a date and forecast often, to name a couple. One of the most watched and anticipated forecasts each year is for the upcoming hurricane season in the Atlantic basin. We have been watching and commenting on multiple forecasts for years because storm disruptions in the U.S. can have meaningful impacts on energy demand and supply, and sometimes both at the same time.
The 2022 hurricane season was uniformly forecasted to be “above average.” That meant that the number of named storms, hurricanes, and major hurricanes, as well as each category’s number of storm days and measures such as accumulated cyclone energy and net tropical cyclone activity, would be slightly above the 1991-2020 average.
The hurricane forecasters we follow most closely include the members of the Tropical Meteorology Project at the Department of Atmospheric Science at Colorado State University (CSU), currently headed by Phil Klotzbach. All their forecasts, made periodically through the season, predicted an above-average storm season.
One reason we follow the CSU professors is that not only do they do a wonderful job of laying out the factors and science behind each of their forecasts, which changes based on their experience with multiple factors at each forecast time, but the team also does a look-back after the storm season ends in November. The table below shows their periodic forecasts this year and the observed 2022 activity and how it compared to the 1991-2020 averages. Only the number of hurricanes observed was above the historical average.

Exhibit 14. Record Of CSU’s Hurricane Forecasts And Evaluation Of Its Success SOURCE: Colorado State University
The CSU team assessed the 2022 hurricane season as “near average for most metrics,” except for the accumulated cyclone energy (ACE) which was below average. We did a calculation of the average for each category forecast and how the observed 2022 activity compared to those averages. Uniformly, the observed activity was 20 percentage points below the performance against the 1991-2020 average. We acknowledge that missing one year’s forecast, which the CSU team analyzed in a 37-page report, doesn’t invalidate tropical storm forecasting, but it should send the forecasters back to the drawing board.
Climate scientist Roger Pielke, Jr. wrote about the CSU forecast and noted that the Barcelona Supercomputing Center (BSC), which crunches the data for CSU, has collected the seasonal hurricane forecasts of 29 organizations, which allows analysis of “just how wrong the community was in 2022.” Nineteen organizations produced forecasts before the start of the season. Of those 19 forecasts, 17 predicted an above-average frequency of “named storms,” as determined by the U.S. National Hurricane Center. By early summer, 19 of 19 forecasts called for an above-average season.
Below, we have presented three charts from the BSC website showing the compilation of forecasts for hurricanes, named storms, and ACE. Each chart has a different number of forecasts as not every organization forecasts each category. The forecasts were in the “above-average” range (red line). The organizations are noted in three categories – universities (aqua), private entities (purple), and government agencies (red).

Exhibit 15. How The 2022 Hurricane Forecasts Were Too High SOURCE: BSC

Exhibit 16. How 2022 Season Forecasts For Named Storms Were Too High SOURCE: BSC

Exhibit 17. The ACE Forecasts Were Too High SOURCE: BSC
As Pielke pointed out:
Hurricane activity is streaky. The past 6 years have all been above median activity, but 2022 breaks that streak. Forecasting above median activity would have been a winner each of the past 6 years but failed in 2022. And 1970 to 1994 (except two years) were all below median.
That doesn’t mean Pielke believes hurricane forecasting should be abandoned. But he did comment on the fact that there has been one meteorological measure that has proven important for forecasters. It arises from the work CSU scientists have been conducting to improve projections of tropical storm landfalls. Improving this forecast could help coastal residents and officials to better prepare for storms and mitigate damage and loss of life. This measure is the relationship between El Niño and the Southern Oscillation (ENSO) that captures the periodic fluctuation in sea surface temperature and air pressure of the overlying atmosphere across the equatorial Pacific Ocean and landfalling hurricanes. Pielke wrote:
In a 2018 paper led by Klotzbach — updating a discovery we first made in 1999 — we showed that landfalling major hurricanes occurred twice as often in La Niña years as compared to El Niño years, and 4 times as often for Florida. With Ian’s landfall in Florida as a Category 4 storm in 2022, this relationship gets even stronger. Climate change is important, of course, but its projected effects on hurricanes are measured in the few percentage points over a century — ENSO has effects that are orders of magnitude larger in just years. Don’t lose sight of climate variability.
Everyone creating tropical storm forecasts or preparing for their arrival is operating in a world of unknowns. Forecasting is dealing with uncertainties and the reality that events might lie outside of the experience observed for the past century and a half. Decision makers must consider the unknown unknowns as well as contemplate how they may be forecasting under conditions of ignorance. The most successful forecasters will be those who can capitalize on understanding what is known and what is unknown.
Leveraging deep industry knowledge and experience, since its formation in 2003, PPHB has advised on more than 150 transactions exceeding $10 Billion in total value. PPHB advises in mergers & acquisitions, both sell-side and buy-side, raises institutional private equity and debt and offers debt and restructuring advisory services. The firm provides clients with proven investment banking partners, committed to the industry, and committed to success.
