

Global Growth And Inflation Fears Control Oil Prices In 2021
“This year will see a strong oil demand rebound after 2020’s pandemic depressed volumes. Forecasters are uncertain if we are embarking on an extended period of above-average GDP growth and oil use increases. ”
The International Monetary Fund (IMF) raised its forecast for global growth in a report published ahead of the organization’s recent annual meeting. The 2021 global growth projection was raised by half a percentage point to 6.0%. The projection for 2022 was also increased, but only by 0.2% to 4.4%. In both cases, the new projections reflect the highest growth forecasts of the past 12 months, which is not surprising given the chaotic economic conditions existing during that time. The higher growth estimates will be key for future petroleum demand projections despite concerns over increasing sales of electric vehicles.
To gain perspective on how shifting views for the pace of the Covid-19 virus and the development of vaccines to protect people impacted growth forecasts, one only needs to look at the IMF’s projection record for U.S. growth. When its April 2020 forecast for 2020 and 2021 was released (having been prepared in March), the IMF was guessing about Covid-19’s impact on economic activity. There was no doubt economic activity was collapsing, as April was the worst month for economic lockdowns. In response, the IMF projected a 5.9% decline for the U.S. economy in 2020, but a 4.7% rebound in 2021. By June, the devastation from the virus led to the 2020 decline being increased to -8.0%. The worsening economy was to be followed by a weaker rebound (+4.5% vs. 4.7%) in 2021.

Exhibit 12. How IMF U.S. Growth Projections Changed SOURCE: IMF, PPHB
By October, the economy was rebounding as various states had reopened and talk about an early arrival of vaccines to protect against the virus was increasing. The question was what would be the recovery’s strength if the vaccines only arrived by the summer of 2021? The happy talk led to the negative 2020 growth forecast being cut to -4.3%, however, 2021’s forecast was chopped more than in half (2.0% from 4.5%) due to the delay in vaccines. An earlier vaccine arrival and rapidly accelerating vaccination effort led to a further reduction in 2020’s negative outlook. In January, the IMF projected a -3.4% decline for 2020, but a huge economic rebound in 2021 of 5.1%. This scenario’s significant economic contraction followed by an explosive rebound was then expected to transition into a typical slow-growth outlook of 2.5% for 2022.
We see the V-shaped economic pattern by examining the 2020 quarterly U.S. growth rates.

Exhibit 13. U.S. Growth SOURCE: IMF, PPHB
The latest IMF forecast calls for 1.3% of additional growth for 2021 along with an additional 1.0% in 2022. The 6.4% growth forecast for the U.S. in 2021 is a rate rarely seen. In fact, one must go back to 1984 to find the last such strong increase. Then, the U.S. experienced 7.2% growth in the ongoing rebound from the 1981-1982 recession helped by the financial stimulus of the Reagan tax cuts. Such rapid growth was also assisted by falling oil prices, as OPEC wrestled with the growing oversupply of world crude oil that had finally forced Saudi Arabia to stop supporting an oil price that market fundamentals could not justify.

Exhibit 14. Reliving Strong GDP And Oil Growth Era In 2021 SOURCE: FRED, EIA, OPEC, PPHB
What we find interesting is to look at the history of years with strong economic growth and correspondingly high petroleum consumption. The dotted green line marks 6% annual growth in U.S. GDP. That high growth rate was experienced numerous times during the 1950s and 1960s and came close several times in the 1970s. The last time U.S. GDP growth was 6% or above was in 1984. During this entire 70-year span, there were eight years of above 6% GDP growth. Excepting 1984 when petroleum consumption rose only 2.9%, each time economic growth was 6% or more, annual petroleum consumption grew 4.2% or more. The years of strongest economic and petroleum growth occurred in 1950 and 1951 when GDP grew 8.7% and 8.0%, respectively, and correspondingly, petroleum consumption increased 11.2% and 8.5%. Those years were followed in 1955 when the economy grew 7.1% and petroleum consumption increased 9.2%.
Based on its April oil report, OPEC projects world oil consumption in 2021 rising by 6.0 million barrels per day, a growth rate of 6.6%. Admittedly, this is a rebound year from the pandemic depressed demand of 2020. For the U.S., oil demand fell on average 2.4 million barrels per day last year, an 11.6% decline. For 2021, OPEC sees U.S. oil consumption growing 1.5 million barrels per day, or 8.0%, adding another year of correspondingly strong GDP growth and petroleum consumption to our history. Albeit in a rebound.
The extended absence of years of substantial GDP growth, not necessarily 6% or more, has prompted research into the measurements and drivers of economic growth and why we have experienced such weak growth. That research is influencing forecasters’ predictions of world and U.S. economic growth in 2021 and thereafter. The IMF believes 2021 will be a year of extraordinary growth but followed by a return to slower growth rates experienced in recent years. On the other hand, there are forecasters who see the U.S. generating even stronger growth this year than the IMF expects, as well as in future years.
James Paulson, of the Leuthold Group investment managers, is one of those more optimistic forecasters. He suggested, in a recent conference call with investors, that growth “could challenge the best ever in postwar history.” He is expecting U.S. GDP growth this year to reach 8% or possibly even higher. He believes many factors exist in today’s recovering economy like the forces that made the 1950s such a strong economic growth period. That is why he told the conference call “There is just so much here that is continuing to stimulate it. We’ve got some juice behind this recovery.”
In essence, Mr. Paulson is talking about an upturn in U.S. productivity, something that has been missing from our economic growth for a while. Three charts on nonfarm business productivity per capita highlight the issue. The first shows the quarterly rate in productivity for 1950-2020, with a trendline superimposed. The trendline reflects the long-term decline in U.S. productivity that we have experienced. The second chart shows the average annual productivity growth by decade, highlighting the strong growth experienced during the 1950s and 1960s and the low growth of the 1980s, 1990s and 2010s. Strong growth was also experienced in the 2000s, but growth then fell dramatically in the 2010s. Lastly, we have a chart showing annual productivity growth during 2000-2020 showing how the strong growth in the early years was followed by very low growth after the rebound in 2009-2010 following the Financial Crisis and the Great Recession.
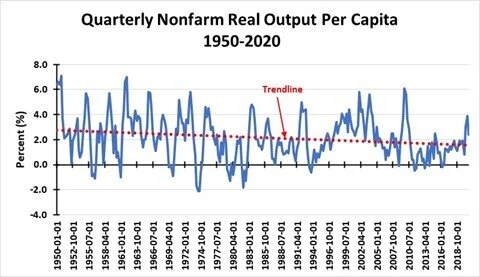
Exhibit 15. Declining Long-term Trend In U.S. Productivity SOURCE: FRED, PPHB

Exhibit 16. U.S. Productivity By Decade, 1950-2020 SOURCE: FRED, PPHB

Exhibit 17. U.S. Productivity Trend For Past 20 Years SOURCE: FRED, PPHB
The take-away from these charts is that the golden years of the 1950s and 1960s benefitted from America commercializing many inventions from the 1930s and 1940s that had been delayed by the Great Depression and World War II. The start of the 1950s also benefitted from the return to a peacetime economy as we unwound the war effort and began investing the capital (savings) stockpiled. The U.S. economy benefitted from rapid growth in the civilian labor force due to returning veterans, in many cases possessing newly minted degrees after GI benefits paid for their college educations, and family formations and birth rates escalated, helping drive consumer spending and housing growth. This all translated into strong productivity growth and significant petroleum consumption.
Examining productivity growth for the past twenty-year record shows the role the dot.com boom at the tail-end of the 1990s had on growth in the early years of the 2000s. That growth was then supported by the shale gas revolution. The explosion in oil prices in those years, driven by the global commodity boom due to the industrialization and infrastructure investment of China, further helping propel U.S. productivity. This growth was disrupted by the Financial Crisis and the 2008-2009 Great Recession, which produced a sharp productivity rebound before collapsing in response to the economic policies of the Obama administration. Obama’s policies undercut the work ethic revival driven by the Clinton administration’s welfare reform efforts of the late 1990s. Increased regulation and taxation helped drive U.S. manufacturing outsourcing, further contributing to the slowest economic recovery after a recession since 1949.
Studies have shown that the Obama economy would have been weaker had the oil shale revolution not begun after the Great Recession. The capital invested and strong oilfield activity produced a healthy boost to national economic activity and drove faster economic growth in oil-producing state economies.
Most oil forecasts call for a return to pre-pandemic demand levels by 2022. There are some recent forecasts suggesting that such oil demand levels may not be reached before 2023, as air transportation’s recovery lags the strong recovery seen in driving. The idea that oil demand peaked in 2019 and will never be reached again is possible, but given the slow pace of energy transitions, this peak may be like the one in the 1970s. In the U.S., it took 18 years before our petroleum consumption peak of 1978 was surpassed.

Exhibit 18. Oil Consumption During First Energy Efficiency Era SOURCE: BP Statistics, PPHB
On a global basis, according to BP statistics, 64 million barrels of oil per day were consumed in 1979, but that total was not surpassed until 1989 when global consumption reached 65.6 million barrels per day. Consumption in 1988 almost matched the 1979 peak, so it required either eight or nine years for the world oil market to recover from the 1970s explosion in oil prices and the recession of 1979. As much as we are focused today on how much transportation oil demand will decline with the increase in electric vehicles in the global fleet, continued population growth in developing economies where oil demand remains strongest suggests it may be premature to be calling the all-time peak in oil consumption.
Given the impact of the pandemic on global oil consumption and the current rebound in virus cases in certain countries now reimposing economic lockdowns, expecting oil demand to fall shy of 2019’s level this year is probably a conservative call. Increased vaccinations during 2021 should ensure a healthy economy in 2022, although the IMF forecast calls for faster growth this year and slower growth in 2022. Maybe these growth projections will be revised this summer.
The other great concern about oil prices is whether they are rising in keeping with the increase in commodity prices generally. These increases are due to demand rebounds and supply chain limitations. The camps of “this is the start of the next super commodity cycle” and “these price increases are transitory” are battling over every economic statistic. One can make a case for each camp. We know commodity industries have under-invested in new capacity, which means a tighter supply/demand balance as demand rebounds. That is a recipe for higher commodity prices. We also know the pandemic has upset logistics for many industries.
For example, the shortage of semiconductor chips necessary for today’s automobiles has caused manufacturers to shut down assembly lines. This is a direct result of supply chain problems. With auto sales slumping as the pandemic grew during the first half of 2020, chip manufacturers shifted production from auto chips to consumer electronic chips, whose products were selling like hot cakes because of the lockdowns. With auto sales now rebounding, the shortage of auto chips is not surprising. Will it be sorted out? Certainly. It is a matter of time. Will the price of auto chips fall once supply increases? A properly functioning market would suggest so.
We have also seen sharp increases in both the Producer Price Index (PPI) and the Consumer Price Index (CPI). The March CPI report showed a 0.6% seasonally adjusted, which was the largest one-month increase since August 2012. The 12-month rate for the CPI showed prices up 2.6%. The PPI increase was more concerning. For March, the index rose 1.0%. Unadjusted, the PPI for the 12-months ending in March rose 4.2%. That was the sharpest annual increase since the 4.5% rise experienced for the 12-months ended September 2011. In other words, costs throughout the economy are rising at the fastest rates in the past two decades. Are the accelerating price indices a temporary situation due to the disruptions caused by the pandemic, or is it the start of a commodity cycle as demand outstrips supply? The answer will only become clear later this year, or maybe not until 2022.
Based on our assessment of the factors that influence oil prices, the modest increases in supply from OPEC+ members currently happening, coupled with financial discipline controlling the purse strings of the U.S. oil industry suggests oil prices will continue to trade around the $60 a barrel level for some time. Prices will gradually move up as oil consumption continues growing.
The global structural oil supply challenge from long-term underinvestment in new reserves will begin to come into play later in 2022 and thereafter. The long-term energy efficiency trend and negative demand pressures from the slow recovery in air transportation and increased electric vehicle penetration in the global fleet will help hold prices down in the future. Oil prices in the $60-$70 per barrel range is probably a good guess for the next 18-24 months, and possibly longer. That price range should still provide profitable opportunities for producers and service companies, as the number of industry players shrink. A smaller industry is positive for survivors and necessary for the industry.
Unfortunately, this is a boring scenario for the industry. Many participants, however, may be ready for boring! We will continue to watch geopolitics and economic policymaking, as these are likely the forces that will disrupt the industry recovery trajectory we are setting forth. Forecasting disruptions is impossible, so we do not attempt to. What we do know is that every time we suggest stability or boring, something changes that we were not counting on. Stay tuned.