

Energy Musings - May 4, 2021

Energy Musings contains articles and analyses dealing with important issues and developments within the energy industry, including historical perspective, with potentially significant implications for executives planning their companies’ future. While published every two weeks, events and travel may alter that schedule. I welcome your comments and observations. Allen Brooks
Welcome to the first edition of Energy Musings, the new name for Musings From the Oil Patch. After two decades, it was time for a refresh, especially given how energy transition issues are dominating the discussion about future challenges. Rest assured our research and focus will not change, but we admit that non-oil and gas topics are dominating the selection currently.
Germany’s Efforts At Decarbonizing Are Proving Difficult
The Energiewende in Germany is driving the decarbonization of the economy, but at high costs for households and risk to business. Now there is concern about an unstable power market.
Settled Climate Science Still Has A Problem With Reality
Settled climate science embraces RCP8.5 scenario, which IPCC said was unrealistic. Climate models continue to spit out forecasts that are much hotter than the actual measurements.
Conflicting Forces At Work For East Coast Offshore Wind
If you are aligned with the Biden administration, or a wealthy Democratic donor you get offshore wind farms either approved or rejected. Offshore wind is the “fair-haired” energy wonderkind.
Offshore Market Struggles As Industry’s Spending Slows
Oil price drop in late 2014 set offshore industry into a tailspin. The expensive industry sector is retrenching and shrinking, and it needs stability before it can recover. The future looks tough.
Germany’s Efforts At Decarbonizing Are Proving Difficult
In 2000, Germany embarked on an effort to decarbonize its primary energy supply, which it refers to as Energiewende (energy transition). According to our research, the term Energiewende first appeared in the title of a report in 1980 by the German Öko-Institut, which called for complete abandonment of nuclear and petroleum energy. Included in the report was a prediction that Germany’s economic growth, which has been significant since the end of World War II, could continue without increased energy consumption, an interesting claim. Shortly after this report was published, various symposiums were held to discuss and amplify the decarbonization theme, although anti-nuclear sentiment was a key driver behind the movement.
Since then, the concept of Energiewende has evolved, as it has reoriented government policy away from energy demand management in favor of promoting supply growth, besides shifting the focus from centralized to distributive generation of energy (heat and electricity). The new policy emphasis was an attempt to replace overproduction and avoidable energy consumption with energy-saving measures and increased energy efficiency. These policy shifts have enabled Germany to boost its share of renewable power, but it has come at a meaningful increase in the cost of electricity.
Renowned environmental scientist Vaclav Smil reviewed the performance of Energiewende on its twentieth anniversary. In the December 2020 Institute of Electrical and Electronics Engineers’ issue of Spectrum magazine, Professor Smil characterized the performance thusly: “The initiative has been expensive, and it has made a major difference.” Based on some of the latest analyses and policy moves, the difference Energiewende has brought to Germany’s power sector has been very costly for households and the German economy, while not reducing carbon emissions as much as the green movement wants. This realization is weighing on officials and leading to changes designed to reduce the financial burden on the population, while seeking to fulfill the objective of Energiewende. Germany’s experience should be a warning to other governments embarking on the road to decarbonization.

Exhibit 1. Share of Germany Energy Production by Fuel Service SOURCE: Clean Energy Wire
Last year, renewables accounted for 44.6% of Germany’s electricity production. However, if you read the footnote to the accompanying chart, it states that “Renewables share in gross Germany power consumption 2020 (without pumped storage): 46.3%.” This is meant to highlight that Germany’s measure of its success with renewable power is based on how it does with consumption and not production. While renewables have seized significant market share of energy production, hydropower and biomass still account for a quarter of the share. Even after 20 years of pushing renewables, fossil fuels still account for over half of Germany’s power production.

Exhibit 2. Long-Term Power Production Shows Shift In Fuel Mix SOURCE: Clean Energy Wire
When we examine the historical record of Germany’s electricity production since 1990, renewables’ growing share is undeniable. In 2000, renewables provided 6.6% of the country’s total electricity generated. Last year it accounted for 44.6%. Since 2006-2008, the growth in renewables’ market share of total electricity generated came at the expense of traditional power sources - fossil fuels.
To highlight how the German power market has changed in recent years, the country produced 540.9 terawatt-hours (TWh) of electricity in 2000. Of that total, 37.3 TWh, or 6.9% was provided by renewables. Within that mix, hydropower accounted for 66.0% with onshore wind at 24.9%. The 9.1% balance was from biomass (41.7%) and household waste (58.3%). By 2020, Germany’s total power output was 567.4 billion TWh, only a 4.9% increase over the 20-year span, but renewables providing 254.7 TWh, or 44.9%, having grown its output 683%. Wind provided 52.8% of renewables, while solar contributed 20.0%. Surprisingly, biomass generated 44.4 TWh of electricity, or 17.4% of total renewable power. Hydropower, household waste and geothermal represented the remaining 9.8%.
From the viewpoint of Germany leading the world in adopting renewables for its electricity generation, the increased share gain over 2000-2020 is impressive. The nearly sevenfold increase in renewables’ share of total German electricity generated would suggest Energiewende is working. However, the success of the effort to date appears to be insufficient for the country’s environmental movement. In response, Germany is planning to aggressively move to cut its carbon emissions to net zero by 2050, in line with the target set by the European Union (EU). Part of Germany’s effort on electricity involves shuttering all its nuclear power plants, a decision made by Chancellor Angela Merkle following the 2011 Fukushima Daiiachi nuclear accident in Japan. Given the historical anti-nuclear sentiment of the German population, Chancellor Merkle’s move was less controversial than one would have expected. Her plan requires the last nuclear power plant to shut down by the end of 2022. This comes as its neighbor France continues to embrace nuclear power for its electricity.
As an aside, France is an interesting study in managing carbon emissions. It derives about 70% of its electricity from 56 active nuclear power plants. While the government is committed to reducing that share to 50% by 2035, France has one new nuclear plant under construction and is considering potentially building several more. Nearly 62 gigawatts (GW) of power comes from the country’s nuclear plants, and electricity from recycled nuclear fuel accounts for 17% of the nation’s power. Coupled with hydropower (12%), wind (5%) and solar (2%), nearly 90% of France’s power comes from carbon-free sources. Due to its low-cost power generation from its nuclear plants, France is the largest net exporter of electricity to its continental and U.K. neighbors, earning the country over €3 ($3.6) billion per year.
The gain in electricity market share for Germany’s renewables validates Dr. Smil’s observation that “it has made a major difference.” However, the weakness he identified - the cost of Energiewende – needs to be examined in assessing the program’s overall success. We begin by looking at the magnitude of investment in power generation capacity. In 2002, Germany’s power generating capacity totaled 114.8 GW, of which 18.2 GW, or 15.8%, was renewable power. Of that total, 12.0 GW came from onshore wind turbines, with hydropower accounting for 4.9 GW and biomass 1.3 GW. Although wind represented only 10.4% of Germany’s total power generation capacity, it did account for 65.9% of total renewables capacity.
By 2020, Germany’s power generation capacity had nearly doubled, reaching 214.2 GW. Renewables had increased to 128.2 GW, a sevenfold increase. Wind, both onshore and offshore, along with solar represented 115.3 GW of capacity, nearly a tenfold increase since 2002. The fossil fuel and nuclear generating sources totaled 85.9 GW of capacity, reflecting a 10.7 GW decline, or an 11.1% shrinkage. The primary reason for the decline was nuclear power, where capacity fell from 22.4 to 8.1 GWs in keeping with the mandated phaseout. Natural gas’ share of capacity increased from 20.3 to 29.9 GW, while shares from oil and hard coal declined. Lignite’s share remained flat. As lignite is the dirtiest fossil fuel consumed in Germany, its generating capacity remaining flat over the past 18 years is a statement about its dependability as a power source and its low cost. It likely also reflects the political sensitivity to coal mining employment in several provinces and the economic harm that would come from shutting down the mines. Growth in natural gas generating capacity and its use has contributed to Germany’s success in reducing carbon emissions.
We know the generating capacity of fuels varies in performance. Renewables generating capacity does not necessarily produce a similar share of output as is the case with fossil fuel plants. This difference between intermittent power sources versus those that can be dispatched on demand is highlighted by the chart showing data on generating capacity compared to output by fuel for Germany in 2019.The chart demonstrates that the share of total generating capacity represented by wind and solar did not translate to an equivalent share of power output. On the other hand, lignite, natural gas, and biomass all contributed greater shares of power output than represented by their respective shares of generating capacity.

Exhibit 3. 2019 Installed Capacity Share Doesn’t Equal Power Output SOURCE: BDEW
A 2016 report by the Climate Policy Initiative (CPI) on “Policy and investment in German renewable energy” contained a chart showing investment in renewables from 2005 to 2015, with a forecast to 2020. It showed the surge in solar investment that occurred in 2008-2011. Onshore wind investment remained steady for most of the period until it surged in 2013. It was forecasted to fall back from the high investment rate but remain at a slightly elevated annual growth rate than experienced in the earlier years. The chart also shows the entry of offshore wind into the renewables mix, something that was forecasted to continue.

Exhibit 4. Investment In Renewable Capacity With Forecast SOURCE: CPI
In the report’s text leading up to the chart was a discussion of the purpose of the CPI report. It stated:
Today, the cost of many forms of renewable energy has fallen to the point where the cost gap has virtually disappeared. Yet policy is still needed, not so much because there is a cost gap, but because the financial, operating and ownership characteristics of most renewable energy investments are different from historical, conventional electricity investments, and these different characteristics need to be integrated with the existing industry and market structures.
The integration challenge doesn’t receive much attention, but it is rapidly becoming a major problem for power grids. However, if the costs of renewables have fallen sufficiently to wipe out the gap with other power sources, one must ask: Why do renewables continue to need subsidies? Remember, this statement by CPI was made nearly five years ago. When we look at what happened to investment in utilities in Germany in the interim, we find the total to have been stable in the €12 ($14.5) billion range since the spike of 2014-2015. This investment pace is appreciably higher than seen in 2010-2011, before the escalating investment that led to the 2015 peak.
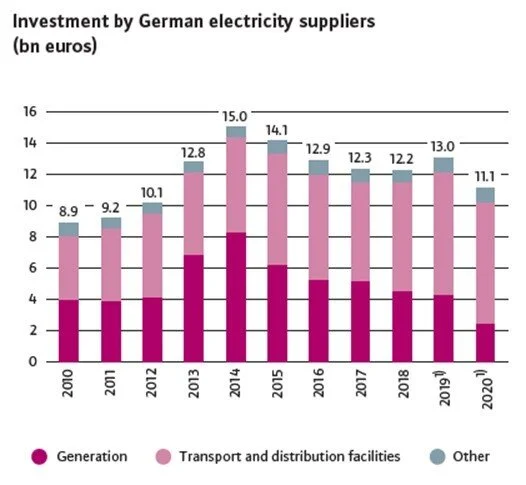
Exhibit 5. Investment Shifts From Capacity To Transmission SOURCE: BDEW
It is interesting to note that only in the 2013-2017 years did generation investment rise. In the most recent years, the percentage of investment being devoted to transportation and distribution has increased materially, part of the issue of power integration. This investment orientation reflects the geographical imbalance of renewable power generation in Germany. Most of the wind and solar installations are in the northern region, but the power is needed in the industrialized southern and western regions of the country. This geographical power imbalance is well understood; connecting the regions is the challenge. Estimates for the new power lines needed to balance power supply and demand increased in recent years. The most recent estimate calls for building 3,700 miles of new high-voltage transmission lines, but, so far, only about 700 miles have been built or are under construction.
Germany is also trying other ways to reduce the North/South renewables imbalance. They are instituting a “southern quote” into their electricity auction scheme. This means that in 2022 and 2023, 15% of new renewables projects will be awarded to plants in southern Germany. That share will increase to 20% beginning in 2024 and thereafter. Only after those threshold percentages have been reached will further renewables bids be considered. One wonders whether the concentration of renewables projects in northern Germany has been driven by better natural conditions (more and stronger wind and more sunny days)? If so, does this policy shift lead to poorer economics for renewables projects awarded in southern Germany? What does it mean for Germany continuing to increase its share of power from renewables?
Another idea that had been embraced, but was recently dropped by government officials, was to allow older wind turbines that had exhausted their feed-in tariff contracts (subsidy payments) to bid in new wind lease auctions. The idea was to avoid having wind turbines that still had remaining life, but were uneconomic without the subsidies, to continue to contribute by securing new subsidies. Because these turbines were older and likely fully depreciated, the idea was that they would accept lower bid prices in the auctions saving the government and ratepayers money. For whatever reason, the proposal was dropped. Without knowing why, we suspect these older turbines would have proven disruptive to the new wind turbines bidding, undercutting their economics, and potentially taking them out of the supply mix. That probably would have disrupted the government’s plans for reaching its net-zero emissions target.

Exhibit 6. Corridors Of Power Transmission Lines Required SOURCE: McKinsey & Company
This geographical imbalance of renewable power supply, primarily wind, and especially offshore wind, is creating other challenges. Because of its large renewables generating capacity, Germany has become a significant source of electricity supply for neighboring countries. However, at times, when the wind is blowing strongly, neighboring turbines that provide power to Germany are sending greater volumes across the border. In these situations, Germany utilities must pay neighboring Denmark wind turbines to shut down, as they cannot take the power given their commitments to take local renewable power first. This situation has led to a growing number of hours of negative power prices that needs to be addressed. The Eastern European Group (EEG), the 23-nation member countries from Eastern, Central and Southern Europe that discuss issues concerning regional and international matters and which Germany is a member, in its latest rules, has modified subsidy payments.
The EEG initially had threatened loss of the subsidy after the first negative hour on the spot market (day ahead pricing), rather than after the six hours currently in place. The subsidy has now been modified such that pilot wind turbines and power plants with an installed capacity of less than 500 kilowatts (kW) are exempt from the loss of the subsidy. Existing turbines and plants remain subject to the prior 6-hour negative pricing threshold. Plants commissioned after January 1, 2021, will lose the subsidy after four negative hours of pricing on the spot market. However, the entire subsidy period is extended by the number of negative hours where no subsidy has been paid.

Exhibit 7. Growing Hours Of Negative Power Prices Upsetting Market SOURCE: Energy Brainpool
The chart above shows the number of hours in 2015-2020 in which pricing was negative in the hourly day-ahead auction. It also shows the number of hours that were negative in the time window of six subsequent hours (blue), or the old rule, and the window of four subsequent hours (red) of negative pricing under the new regulation. The significance of the problem is reflected by the growing total number of hours of negative pricing and the need to address the amount of government subsidies being paid and what those subsidies are doing to upset the German power market. It is estimated that the restructured rules and loss of subsidies would have meant that power producers would have received 30%-50% less in subsidies associated with negative pricing hours. What this means for the economics of wind turbines is unknown.
To appreciate the problem the EEG is attempting to resolve, we only need to look at the CPI analysis of risks to Germany’s electricity market structure and its ability to attract investment. Since the CPI report was focused on the dynamics of renewable energy investment, it explored the negative power pricing issue. CPI pointed out that over 2009-2014, negative hourly electricity prices had occurred on average for less than a hundred hours a year. In preparing its report, CPI interviewed investors. It found that given the history of negative hourly prices, investors were not overly concerned. CPI did find, however, that investors who “expressed concern often regarded negative prices as the single biggest issue facing renewable energy investment.”
CPI modeled the hours of negative pricing assuming flexibility of subsidies and operators remained as it was. They pointed out that debt investors look to protect their loans from default, so they are concerned with the probabilities of high estimates (P90) of negative price hours, as that will determine how much debt wind farms can have in their capital structure and still provide comfort to lenders against default risk. On the other hand, equity investors are more likely to focus on average probabilities (P50).

Exhibit 8. Negative Price Hours Are Well Ahead Of 90th Percentile Forecast SOURCE: CPI
From the hourly chart, there were 667 hours of negative pricing in 2020, which was above the P90 line. This highlights the challenge that CPI was grappling with in its assessment of investor reaction to increased hours of negative pricing. As CPI pointed out, “the cost of curtailing renewable energy is very high due to the revenue risk and uncertainty that it imposes on investors and the higher returns (and lower levels of debt) that would be required to compensate investors for that risk.” The report went on to examine how investors would react to higher levels of negative pricing. “By 2020, seeing curtailment levels approaching 500 hours by 2025 and then rising, investors would need prices over 30% higher to achieve their financial objective than if they were paid for all of their output at the fixed price.” That possibility is shown in the accompanying chart from the report showing bid pricing with reduced output and either adjusted financing or no financing change versus a bid price with a take-or-pay contract. CPI explored various other options for adjusting pricing, which is prescient for the EEG action, as the number of negative hours has increased faster and sooner than projected.

Exhibit 9. Impact Of Curtailment On Energy Prices Or Bid Prices SOURCE: CPI
The negative pricing subsidy rule change is one attempt to address the cost of the transition to a net-zero emissions economy. In Germany, the government has just moved to make another change to ease the burden on citizens. In 2020, the average monthly household electricity bill for 3,500 kilowatt-hours (kWh) was €91.50 ($110.66). Since 1998, that bill has increased 83%. The actual cost of the electricity consumed was only €43.43 ($52.52), and it has only increased 14% during that 22-year period. The difference between the cost of power and the total monthly bill is accounted for by various fees and taxes. That component of the average household’s bill has increased by 305%. The bill’s various taxes, levies and surcharges are virtually all associated with renewable power, therefore that component of the bill will continue to grow, even if the cost of electricity declines.

Exhibit 10. Energiewende Has Exploded Residential Power Bills SOURCE: BDEW
The escalation of the average monthly electricity bill for Germans came because the government tilted financing the cost of Energiewende towards households and away from businesses. That tilt was necessitated to protect the competitiveness of Germany’s industries and, therefore, employment. The belief was that if Germans were employed, they could cope with higher electricity bills. However, German households are now paying the highest electricity bills in Europe (43% above the average in the EU), and monthly bills three-times the average bill of U.S. households. The pressure for adjustments to rebalance the cost sharing of the clean-energy move has grown. In fact, Energiewende and the clean energy movement will play a major role in the upcoming September election.
For the next two years, one of the renewables fees assessed to household electricity bills is being removed and its funding shifted to the German government budget. As welcome as that move will be for households, the reality is that this is a temporary adjustment, likely needed to be addressed following the upcoming parliamentary elections. The issue is best framed by the following chart showing that the cost of the green energy revolution was over €30 ($36) billion in 2020 and has grown by more than 50% over the past seven years. This is an economic burden trajectory that is unsustainable without crippling the German economy and making it uncompetitive. This is partly behind the effort of German politicians to strike a deal with China, its main manufacturing rival, to protect the local industrial sector.

Exhibit 11. Cost Of Energiewende Is Growing Strain On Germany SOURCE: Bloomberg NEF
At the end of March, Daniel Wetzel of the German newspaper Die Welt published an article based on the draft report of Germany’s Federal Audit Office on the state of Energiewende. The report warns: “If things continue like this, Germany as a business location is in danger. The costs are out of control – and there is a growing threat of an electricity shortfall.” The government auditors say that Energiewende is a “danger for all of Germany.”
This is not a new criticism from the auditors, who voiced harsh criticism in a special report three years ago. In that report, their focus was on the high cost of Energiewende. This report now adds “an explosive analysis” on power supply instability and the high probability of power shortfalls. Increased renewables in its electricity system have contributed in recent years to Germany nearly suffering serious power blackouts numerous times, forcing utilities to resort to increased coal and oil use. As a result, the auditors stated that the government “does not have a sufficient view of the emerging, real dangers to the security of supply” and that “ever higher electricity prices” are to be feared in the current system.
Although Germany’s electricity is already among the most expensive in the world, the cost is likely to continue its upward spiral due to needed investments. Die Welt found that one study estimates that Germany’s power grid needs to be upgraded at a cost of €525 ($635) billion by 2025 (those pesky transmission lines). Due to the rising cost issue, the Federal Audit Office is concerned that Energiewende could “endanger Germany as a business location and overburden the financial sustainability of electricity-consuming companies and private households.” According to the President of the Federal Court of Audit, Kay Scheller, “This can then ultimately jeopardize the social acceptance of the energy transition.” With Germany’s Green Party approaching parity with the Christian Democratic Union in public polling ahead of the upcoming election, the incoming government and new chancellor will be facing critical decisions as to the direction the country goes not only with its energy and carbon emissions policies, but also its foreign policy.
“Since our last review in 2018, too little has been done to successfully shape the energy transition,” said Ms. Scheller. Germany is endeavoring to transition its automobile manufacturing industry into a leadership role in the global electric vehicle industry, it will be necessary to build a massive battery industry. That will require a power grid to support the industry. If the government’s essential assumptions concerning the security of supply are “unrealistic or outdated,” as the Federal Audit Office believes, Germany, its economy and people could be headed for serious problems. Who might be next?
The latest twist was a ruling by the German constitutional court that the lack of clarity about climate policy details post 2030 may endanger human rights. There is concern that the intergenerational sharing of the country’s CO2 budget could jeopardize the rights of younger citizens by forcing them to have to make drastic lifestyle changes. The government has said it will work to provide greater clarity about future carbon policies, and how the perceived national CO2 budget will be shared among the various age groups. Expectations are that this effort will fall to the next government. The immediate reaction is that this court ruling will strengthen the political position of the Green Party heading into the September elections. Could this mean a more draconian climate policy in the near-term for Germany?
Settled Climate Science Still Has A Problem With Reality
If you caught anything from the streaming sessions of the virtual Leaders Summit on Climate on Earth Day, it was that we need to mobilize the world to tackle the climate crisis, while meeting the demands of science. We found it interesting that the Biden administration did not resort to calling the climate issue an “emergency,” although that is how the media, including a long-standing holdout, Scientific American, are now calling it. It was also surprising that there wasn’t commentary about the science being settled, which may have been a political move to avoid embarrassing those countries that were not boosting their earlier emissions reduction targets.

Exhibit 12. Could This Really Be Outcome Of Settled Science? SOURCE: BabylonBee.com
To demonstrate how serious the Biden administration is for governing through a ‘climate change lens,’ the U.S. State Department web site reporting on the conference stated: “With the science telling us that the world needs to significantly increase the scale and speed of climate action, President Biden considered it vital to host this Summit within his first 100 days in office to make clear that it is a top U.S. priority to combat the climate crisis at home and abroad.”
We wondered if this message could have been accomplished by President Biden singing the Marines’ Hymn – “From the Halls of Montezuma. To the shores of Tripoli." We are about to fight climate change everywhere. As researchers have pointed out, the opening words of the hymn state a factually incorrect point. The building the marines stormed in Mexico City in 1847 was built by the Spanish rulers of Mexico more than two hundred years after the Aztec Emperor Montezuma was overthrown. A myth masquerading as a rallying cry?
Maybe Mr. Biden’s mission was to impress on other leaders – including several from leading polluting countries with weak commitments to controlling and reducing emissions – that this was a battle he was embracing regardless of the costs. Maybe it was akin to U.K. Prime Minister Winston Churchill’s address to Parliament on June 4, 1940, after Germany had pushed British and French troops off the continent. At the end of that speech, Mr. Churchill pledged:
We shall go on to the end, we shall fight in France, we shall fight on the seas and oceans, we shall fight with growing confidence and growing strength in the air, we shall defend our Island, whatever the cost may be, we shall fight on the beaches, we shall fight on the landing grounds, we shall fight in the fields and in the streets, we shall fight in the hills; we shall never surrender…

Exhibit 13. Climate Change Still Is Not Major Concern Of Americans SOURCE: Gallup
The reason why politicians and environmentalists resort to aggressive language and images of fighting is due to the attitude of Americans to the climate change issue. According to the April Gallup poll about the most important issues worrying Americans, only 2% listed Environment/Pollution/Climate Change. One wonders what the percentage would be if the category was only climate change? Would the concern have even registered?
It seems that climate change only becomes a concern for Americans when they are asked specifically about climate change. Maybe that is because people recognize other, more pressing social and economic issues than worrying about something that may or may not become a problem some decades in the future. It is also possible the public understands the difference between weather and climate change. Yes, the fear of climate change has been marketed on the backs of children and grandchildren, and concern about the legacy left to them by the current generation. But that argument for climate change is weakened every day that our government, and other western countries, adds more debt and prints more money, something people know will have a more immediate impact on their lives.
There is another challenge for the climate change argument, which is its projections for how much and how soon the planet will get hot. The attempt to link severe weather events with climate change continues to break down as the data is analyzed. The trends for the number of tornadoes, hurricane landfalls, acres burned by wildfires, floods and droughts continue downward as global temperatures rise. This does not mean that we should dismiss the possibility that individual weather events can inflict serious harm on people. However, it is also possible that steps can be taken to mitigate and protect them from the worst effects of such weather events.
As the screed over climate emergency grows louder, we find it interesting that influential members of the environmental community are retreating from the hysteria in favor of explaining rationally what the science truly tells us and what it does not. They are also willing to suggest alternative responses to mitigate the worst effects of climate change, especially at a lower social and economic cost. Because of their historical involvement in the climate research, it is hard for them to be labeled “climate denier.” Environmentalists such as Bjorn Lomborg and Michael Shellenberger, and the co-founder of Greenpeace, Dr. Patrick Moore, have all published books recently pointing out the reality of climate change research and the failures of climate models that support the movement’s religious fervor. They are also willing to educate the public about alternative actions that can mitigate the worst effects of climate-impacted weather events and conditions. Soon we will have a new book in this mix (destined for my Kindle) from physicist Steven Koonin, who was President Barack Obama’s chief scientist at the Energy Department. He also did a stint as the chief scientist advising John Browne, now Baron Browne of Madingley, when BP was dubbed “Beyond Petroleum.” Mr. Koonin has been featured in articles and interviews with Holman Jenkins of The Wall Street Journal, Alex Epstein of The Moral Case for Fossil Fuels fame, and Mark Mills of the Manhattan Institute and Northwestern University’s McCormick School of Engineering and Applied Science.
As Mr. Jenkins wrote about Mr. Koonin’s views in an interview, “what the media and politicians and activists say about climate science has drifted so far out of touch with the actual science as to be absurdly, demonstrably false.” Mr. Koonin pointed out that in 2019, a report by the presidents of the National Academies of Sciences claimed that the “magnitude and frequency of certain extreme events [weather] are increasing,” yet the United Nations Intergovernmental Panel on Climate Change (IPCC) reports that such claims should be treated with “low confidence.” That means not likely.
This is like the media’s reporting the IPCC’s worst-case scenario – RCP8.5 - for climate change. RCP stands for “Representative Concentration Pathways,” which yield projections of how much CO2 will accumulate in the atmosphere due to increased use of fossil fuel over the balance of this century. The IPCC generated four RCP scenarios a decade ago, labeling each by how much “radiative forcing” (a measure of global warming potential) each one generates. RCP2.6 refers to a benign, low-end emission scenario with correspondingly minimal radiative forcing. There are two mid-level radiative forcing scenarios – RCP4.5 and RCP6.0 – and then there is the highest in RCP8.5. The high forecast predicts historically unprecedented increases in global CO2 emissions.
How unprecedented are the CO2 increases? From 1920 to 2000, global coal consumption ranged between 15 and 20 gigajoules [a measure of energy equivalent to the energy contained in nearly seven gallons of gasoline or 278 kilowatt-hours of electricity] per capita, reaching its high point in 1960 and its low in 2000. Since then, the measure climbed to 23 earlier this decade with the rapid industrialization of India and China. The International Energy Agency expects the ratio to gradually return to the 15-20 gigajoule per capita range by 2040. To the contrary, RCP8.5 projects the measure climbing to about 30 gigajoules by 2040, then to 45 by 2060 and ultimately reaching 70 gigajoules by 2100. No one believes this scenario, including some who use RCP8.5 in their climate simulations.
Further complicating the value of this scenario is what a recent study by Matthew Burgess of the University of Colorado and his co-authors points out. RCP8.5 predicts so much global economic growth, that today’s poor countries will be richer than the wealthiest countries are today, but they will also experience so much warming they become uninhabitable. How can both situations be true?
Understand that RCP8.5 was conceived as an outlier – an improbable worst-case scenario – and not a ‘business-as-usual” forecast. However, scientists and economists are presenting it as the latter. Those dishonest climate-change promoters put RCP8.5 into their climate models, observe the resulting catastrophe, then call it the “likely” base case for a no-policy on emissions reduction outcome. Fortunately, two climate experts wrote in Nature magazine last year about the misleading actions of their colleagues for engaging in such a distortion of climate models as they endeavor to influence public policy debate. We anticipate that Mr. Koonin’s book will be making a similar argument. But what we found amusing (having faced similar criticisms) was Mr. Koonin’s comment that he expects the mainstream climate community to try to ignore his book, limit the number of interviews he has, and then engage in a full-throated distorted critique of the book. He told Mr. Jenkins that “My married daughter is happy that she’s got a different last name.”
Last June, in an article published by the Fraser Institute in Canada, Ross McKitrick, Professor of Economics at the University of Guelph, wrote about the RCP8.5 scenario and its evolution. He also touched on the Nature article’s critique. Mr. McKitrick included a chart derived from the data in an appendix to the article. We have presented both charts for reference. They show the range of climate model forecasts for future CO2 concentrations in the atmosphere. These forecasts begin in the 1970s and continue through the 2000s. What they show is that the low end of forecasts has been more in line with actual results than the high-end estimates.

Exhibit 14. Simplified Summary Of CO2 Forecasts Since 1970s SOURCE: Fraser Institute

Exhibit 15. All CO2 Forecasts From 1970s Through 2000s SOURCE: Geophysical Research Letters
A brief history of RCPs and how they suggest the world’s carbon emissions could play out may be helpful. RCPs are the third generation of emissions scenarios utilized by the IPCC. The first series (IS92) was published in 1992, while the Special Report on Emission Scenarios (SRES) was issued in 2000. RCPs were introduced in preparation for the fifth IPCC assessment issued in 2014. All these scenarios represent sets of standards used primarily by climate modelers, so everyone starts from the same point and understands the values used. These scenarios are seen as cost-savers for climate modelling, which is an expensive undertaking.
Before introducing the RCP scenarios, the IPCC’s SRES scenarios ranged from a low and slow CO2 growth to a high growth one. The top carbon emissions scenario (A1Fl) was considered unrealistic by climate modelers, but its forecast enabled the IPCC to issue its scary sounding “up to six degrees” of warming forecasts. Mr. McKitrick published an article in April 2002 documenting that by the time A1FI was shown to experts in early 2000, the scenario was known to have overestimated global coal consumption growth in the 1990s by 40%.
The SRES scenarios were further challenged in 2002 when the former Chief Statistician of Australia and former OECD Chief Economist wrote to the IPCC informing them that the SRES team had used an incorrect formula for computing foreign exchange rates. That mistake exaggerated the growth and emission forecasts in low-income countries, distorting the model’s forecast. In 2012 and 2013, Mr. McKitrick and co-authors published articles showing that the likelihood of SRES emission scenarios could be assessed using historical evidence and indicators of how global energy markets constrain the use of fossil fuel. Moreover, each time they showed how the lower half of the range of the scenarios was more probable than the upper end.
To further understand how the RCPs work, the following may be helpful. To develop possible pathways under the four scenarios, each pathway establishes two values in 2100 – how much the planet has heated and the concentration of greenhouse gases. Since each RCP differs greatly in the rate of forcing and emissions, the different rates, or trajectories, form the pathways. The following chart shows two examples of pathways. In the left-hand chart, we have the four pathways for CO2 emissions up to 2100, in gigatons of carbon. The right-hand chart shows the corresponding total concentration of CO2 over the same period, measured in parts per million. Note how extreme RCP8.5 is for both measures.

Exhibit 16. Key Assumptions For IPCC Pathways To Climate In 2100 SOURCE: The Guardian, IPCC
Interestingly, each RCP was developed independently by a modelling team whose previous work was a close match to the starting requirements for the new scenarios. If this were an award for prior forecasts, one would have thought the modelers would have been asked to assess how their prior models differed from consensus models and whether their thinking could be captured in new forecasts. Reportedly, to develop the trajectories of emissions and forcings, the teams reviewed the existing literature and synthesized values for a wide range of scientific and socioeconomic data like population growth, GDP, air pollution, land use and energy sources. From these efforts, predictions about the amount of energy needed and its fuel mix in 2100 was developed.

Exhibit 17. Potential Energy Mix In IPCC Scenarios SOURCE: The Guardian, IPCC
We find ourselves staring at the columns in the accompanying chart on the energy situation in 2100 under the different scenarios. Under RCP8.5, the world will use four times the amount of energy as consumed in 2000, and 60% more than the next highest scenario (RCP4.5). Coal usage in RCP8.5 alone nearly equals all the energy needed in RCP2.6 and RCP6. We could go on and on, but look at the various fuels – oil, natural gas, nuclear, bioenergy and renewables – for the various RCPs and think about the implications for their availability and cost. This exercise will reinforce why RCP8.5 is unrealistic. It also reinforces why scientists, politicians and media who embrace this scenario as “realistic” or “business-as-usual without climate actions” are dishonest.
If IPCC scenarios produce carbon emission forecasts that grossly over-state the amount of CO2 that enters the atmosphere, then their outcomes will be misleading, too.It also calls into question whether the drastic actions to limit carbon emissions are as warranted as environmentalists claim.Another evaluation of climate models is being undertaken by climate scientists Roy Spencer and John Christy who are working on a project to explain global ocean temperatures since the late 1800s with a one-dimensional (1D) climate model. This test is to see if simpler climate models may work as well or better than more complex ones.
The accompanying chart shows a plot of the monthly global (60N-60S) average ocean surface temperature variations since 1979 for 68 model simulations from 13 different climate models. The 42 years of observations since 1979 (bold black line) shows that warming is occurring much more slowly than the average climate model says it should have.

Exhibit 18. History Of Real SST Measurements Is Below Model Forecasts SOURCE: Roy Spencer
A second chart Messrs. Christy and Spencer posted shows temperature trends since 1979 for two of the top-cited ocean temperature datasets compared to a range of climate model simulations. Those two observational temperature data sets are near the bottom of the range of the climate model simulations. This is another example of how climate models overestimate temperatures.

Exhibit 19. Real Data Measurements Well Below Model Forecasts SOURCE: Roy Spencer
While many people will fail to pay attention to the contrary analyses and alternative solutions for climate change put forth by Messrs. Koonin, Lomborg, Shellenberger, and Moore, they should be heard. These are people with groundings in climate science and research, and more importantly, the workings of climate models. They understand the limitations of these models. They all acknowledge the warming of the planet, but none of them buy into the climate change hysteria. They recognize that politicians with little or no scientific expertise, are being prompted to enact economic and social changes that could prove destructive to our world. Instead of embracing “emergency,” we like President Joe Biden’s use of “challenge” when trying to deflect the situation on our southern border. Challenge is a better term, which would also be the appropriate governor on the pace of our climate change response. Unfortunately, we hold out little hope this will happen.
Conflicting Forces At Work For East Coast Offshore Wind
In his first week in office, President Joseph Biden issued an Executive Order calling for building a new American infrastructure and clean energy economy that will create millions of new, well-paying union jobs. One commitment was to expand opportunities for offshore wind. Approximately two months later came the proposal to install 30,000 megawatts (MW) of offshore wind along the East Coast by 2030.
One high-profile initiative was the announcement of a new priority Wind Energy Area in the New York Bight, an area of shallow waters between Long Island and the New Jersey coast. While the Biden administration hyped the number of potential jobs that could be created by the project and the ongoing maintenance support for the thousands of wind turbines located there, it also set forth an accelerated timetable for moving forward. According to the announcement, the Bureau of Ocean Energy Management (BOEM) will publish a Proposed Sale Notice to be followed by a formal public comment period and then a lease sale in either late 2021 or early 2022.
The New York Bight is a 16,000 square mile triangular area in which New York Governor Andrew Cuomo and New Jersey Governor Phil Murphy want to construct at least 18,000 MW of wind capacity by 2030. Assuming a generating capacity of 5-MW per turbine, this project would require 3,600 of the 850-feet tall turbines being erected at the rate of one per day for the next decade. Given the Biden administration highlighting this project, it will be interesting to see what corners are cut to facilitate it. We are already aware of a couple.
During the Trump administration, offshore wind projects were moving forward following lease sales off the coasts of Massachusetts, Long Island, New York, and the Maryland/Virginia. One project, an 800 MW wind farm off Martha’s Vineyard, Vineyard Wind, was in the final approval process in 2019. The draft environmental impact statement (EIS), however, found the project would have adverse impacts on fisheries habitat and endangered species, so more research needed to be performed. As a result, the application was withdrawn.
Last December, the Trump Department of the Interior issued a detailed memo stating that the Outer Continental Shelf Lands Act prohibits offshore wind approvals if a project would interfere with commercial fishing interests. Vineyard Wind had already adjusted its proposed wind turbine layout to accommodate the operation of fishing vessels within the wind farm. We now know that a few weeks ago, the Biden Department of Interior reversed its December ruling. Vineyard Wind was suddenly approved in March, as BOEM issued its final EIS and found the project’s impacts on fishing interests would be “minimal.”
Two weeks ago, Long Island newspaper Newsday, in an exclusive, reported that the federal government had removed two contested offshore wind-energy areas off the Hamptons from the upcoming lease sale of waters off Long Island’s South Shore. BOEM cited conflicts with commercial fishing, shipping, and lack of commercial viability for one of the two areas as the reasons for the withdrawals. When you read the conflicting comments from various parties involved, however, one is left with the clear perception that these two lease areas were eliminated because of politics. Because the wind turbines could be seen from shore, the owners of summer homes along Long Island’s South Shore were upset and complained. This reminds us of the Cape Wind battle in Nantucket Sound off Cape Cod, Massachusetts back in 2013. Then, it was the Kennedys, the Kochs and other wealthy, powerful and politically connected families who did not want to see offshore wind turbines from their summer homes that fought the battle. Those elites were like the ones fighting the turbines this time.
The prospective Hamptons wind farms were opposed by the supervisor of Southampton Town who called the announcement of the cancelation “excellent news.” In a Newsday interview, Doreen Harris, president and chief executive of the New York State Energy Research and Development Authority, called the Fairways areas "suboptimal," in part because of viewshed issues. She went on to say that the state believed enough power could be gained from the remaining areas to meet its goal of 9,000 MW by 2035.

Exhibit 20. Where Cancelled L.I. Lease Sales Were SOURCE: Newsday.com
Commercial fishing groups were upset at their treatment in the review process, noting that efforts to engage “resulted in effectively no accommodations to mitigate impacts” from developers and the government. A letter from the group said, "Individuals from the fishing community care deeply but the deck is so stacked that they are exhausted and even traumatized by this relentless assault on their worth and expertise." Will BOEM saying commercial fishing interests were among the reasons the two Hamptons areas were excluded be enough to make the group happy? We will know when and if lawyers representing the group show up at the next hearing.
There is still the interesting fact that in a March 26, 2021, memorandum by BOEM’s chief of renewable programs to BOEM’s director, who concurred, both wind-energy areas off the Hamptons were recommended for inclusion in the lease sale delineation. There was no response from Newsday’s request for an explanation for the about-face in two weeks. Politics anyone?
Offshore Market Struggles As Industry’s Spending Slows
We have been a long-time observer, and a participant, of the offshore drilling industry. The recent issue of Offshore Magazine contained an article about offshore rig managers, as well as a forecast of global drilling and well services expenditures out to 2025. The offshore drilling article focused on the top ten contractors and how dominant they are in the industry. That importance is likely not to diminish in the future given industry trends.
The impact of the Covid-19 pandemic on global economic activity and oil demand was memorable last year. For the offshore oil industry, 2020 marked merely a continuation of the six-year industry downturn kicked off by the oil price collapse in late 2014.
To refresh readers’ memories, global oil prices peaked in June 2014 at slightly over $100 a barrel. From that point, oil prices slid to about $80, at which point Saudi Arabia pulled the plug on supporting OPEC’s target oil price and began to step up exports while cutting prices for buyers in Asia. As the house-of-cards that was the global oil market at that point (high prices cut demand and increased supplies) came crashing down, we anticipated several years of struggle for the offshore market to stabilize. Many oil company executives, traders and analysts expected a V-shaped recovery, like what had happened in 2009-2010 after the Financial Crisis and Great Recession. Others, such as BP’s CEO Bob Dudley, characterized the years ahead as a “lower for longer” oil price environment necessitating radical adjustments to petroleum company strategies and operations. So far, his foresight seems to have been rewarded.
The oil industry boom had to unwind. That meant capacity had to be cut. For the offshore sector, it was amid the largest expansion in its history, as shipyards were overflowing building new deepwater drillships and semisubmersible drilling rigs. When the music stopped, the rig building continued, partly because operators were convinced offshore drilling, and especially deepwater drilling, would resume its upward trajectory. Operators were also stuck with contracts or indications of possible contracts that would provide the funding for new rigs. Finally, there was the latent fear that the boom might resume and if a contractor sold a rig under construction or exited its future shipyard slot, it would be disadvantaged in a recovery, having to go to the end of the line for new rigs. These were all justifications for ploughing ahead.

Exhibit 21. How The Offshore Drilling Fleet Has Growth Through Time SOURCE: ODS, Allen Brooks
Now that the industry is forced to contract, much like the last half of the 1980s and early 1990s, few rigs are being added and more are being removed. Neither trend is linear, as contractor motivations shaped by various commercial factors. We can see how rigs are being retired or scrapped since 2014 through the first quarter of 2021.

Exhibit 22. How The Offshore Rig Fleet Is Shrinking SOURCE: Houston Chronicle
According to IHS, the total offshore rig fleet contained 914 units at the end of 2019 but then shrank by 41 to 873 during 2020. Assuming five more rigs were removed from the fleet in the first quarter of 2021, the world fleet should be at 868 rigs. This is where we get into definitional issues with respect to offshore rigs. There are some offshore rigs that are limited to extremely shallow water and therefore geographically limited. They are technically included in the global rig fleet, but they are not part of the competitive fleet. In addition, there may be rigs effectively retired from service, but not officially acknowledged by their owner. Should they still be counted? These definitional issues are treated differently by the reporting groups. The lack of clarity on how these issues are handled muddies the water when comparing different rig counts. The classic example is between IHS and Baker Hughes.
The IHS April 23rd weekly statistics, shows that the total worldwide offshore rig supply contained 717 units, down 36 from a year before. This is well below the earlier assessment of the total offshore rig fleet. IHS says the marketed supply was only 596 of the 717 rigs, of which 485 rigs were contracted. In the Gulf of Mexico, IHS lists total rig supply at 57, 32 marketed and 22 contracted rigs. Baker Hughes, on the other hand, listed 11 rigs drilling in its weekly count. But these are rigs that were drilling (turning to the right), which is the key measure if you are selling drillbits. If you are concerned about offshore drilling contractor revenues and earnings, then the contracted measure is more important.
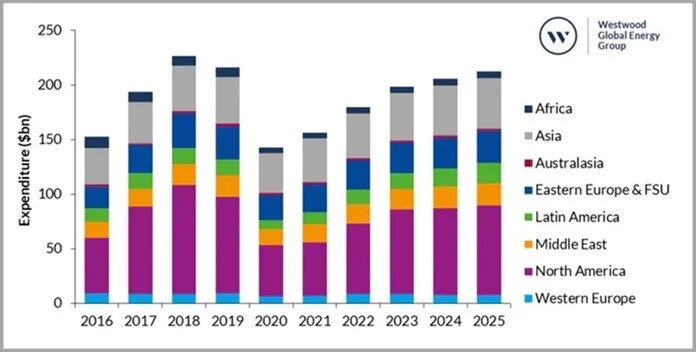
Exhibit 23. Industry Capital Spending Can Be A Guide To Offshore Market SOURCE: Offshore Magazine
Regardless of the rig measure considered, we see a shrinking offshore rig fleet trend. Wall Street analysts, industry publications and consultants attempt to track the amount of capital oil and gas companies are spending on new drilling and completion work. They attempt to separate the money by offshore versus onshore, but that is challenging. However, merely looking at overall industry capital spending still provides a guide for the offshore market. The Westwood Global Energy Group had a forecast for global drilling and well service expenditures by region for 2016-2025 in Offshore Magazine. It shows spending peaking in 2018 at about $225 billion, before declining by roughly $5 billion the next year. The 2020 pandemic year saw spending collapsing to $145 billion. This year, the forecast calls for about a $10 billion increase. From the 2020 low to 2025, the petroleum industry is projected to increase spending by $55 billion, or a roughly a third from the low.
What we are learning from oil company first quarter earnings conference calls is that exploration and production spending remains restrained. In some cases, the amount of money going strictly to exploration drilling is being sharply curtailed, partly due to a lack of attractive prospects, but also due to financial discipline pressures from investors and corporate strategies to reorient toward green energy investments. All these pressures will continue for the foreseeable future, putting increasing pressure on the expensive offshore drilling industry to adjust. Shrinking the global rig fleet will be a necessary step, and we expect the trend to continue.
Even though the offshore is the least explored region of the world, it is the most expensive endeavor most oil and gas companies undertake. That hurdle, in today’s world, remains the greatest challenge facing offshore drilling contractor managements. This challenge is producing a bleak outlook for their employees and suppliers. The people who populate and operate the offshore industry are resilient. But their future currently reminds us of the college freshman lecture: Look to the left of you; look to the right of you; only one of the three of you will be here in four years.
Leveraging deep industry knowledge and experience, since its formation in 2003, PPHB has advised on more than 150 transactions exceeding $10 Billion in total value. PPHB advises in mergers & acquisitions, both sell-side and buy-side, raises institutional private equity and debt and offers debt and restructuring advisory services. The firm provides clients with proven investment banking partners, committed to the industry, and committed to success.
