

Energy Musings - July 6, 2021

Energy Musings contains articles and analyses dealing with important issues and developments within the energy industry, including historical perspective, with potentially significant implications for executives planning their companies’ future. While published every two weeks, events and travel may alter that schedule. I welcome your comments and observations. Allen Brooks
Coal Prices Climbing Despite Push For Restrictions
Germany’s coal demand is climbing as renewables cannot handle uncooperative weather. The country restarted four mega coal-fired power plants in spinning mode, requiring subsidies.
Scarcity To Plenty – What Really Drives Oil Markets
Peak oil concerns are tied to slowing demand due to climate change. It once meant fear of a lack of oil supply. A new paper says declining oil intensity will cause the market to peak. But when?
Solar Promise Faces Cost And Supply Chain Issues
Governments and environmentalists are pushing solar for its low-cost power. A HBR paper from sustainability professors in Europe calculate that solar waste will boost solar power cost 4-fold.
Thoughts On Current Energy Market Issues
The Supreme Court’s PennEast ruling has implications for green energy infrastructure. Heat waves are triggering power blackouts and NY’s nuclear shutdown hurts residents and its climate.
Coal Prices Climbing Despite Push For Restrictions
OMG! We are going to talk about coal. When was the last time we focused on coal, other than to point out how its share of the U.S. and global energy mix is shrinking? On the other hand, whenever we discuss challenging electricity markets (the grid), we are often forced to reference how coal remains key to meeting demand when renewables are unavailable. So far this year, coal’s role in keeping the lights on and homes heated has expanded, primarily in Europe and Asia. In fact, the growing importance of coal, despite forecasts for its imminent demise, is showing up in global coal prices! But first, we need to take a quick look at renewables in Germany, and particularly wind energy to assess coal’s outlook.
For the first half of 2021, the German Association of Energy and Water Industries and the Centre for Solar Energy and Hydrogen Research Baden-Wuerttemberg reported that renewable power’s share of Germany’s power consumption had dropped to 43%, well below the 50% share achieved in the same period last year. The reason? Unfavorable wind conditions and fewer sunshine hours, i.e., cloudy/stormy days, this spring. As one would expect, the emphasis of the press release was putting a positive spin on renewables. The release cited solar power generation having grown by 2% compared to 2020, but wind power, output both from onshore and offshore turbines, dropped 20%.
Under new EU rules, the reporting for energy is to be tied to a fuel’s share of consumption and not production or generating capacity. In other words, who is doing the heavy lifting in meeting the needs of consumers, rather than potentially producing surplus electricity, and having it exported or dumped. The release commentary mentioned that power production in the first half of this year totaled 292 billion kilowatt hours (kWh), an increase of 4.7%. Power consumption, on the other hand, increased 5.2% to 285 billion kWh. Renewable power output fell from 137 to 122 billion kWh, while power from conventional sources increased nearly 20% to 170 billion kWh.
What is wrong with this picture? Germany’s goal is for renewables to reach a 65% market share by 2030, less than a decade away, and environmentalists are clamoring for it to be 70%, or higher. As we will discuss later, the 43% market share for renewables is beginning to be a problem in keeping the lights on AND cutting carbon emissions!

Exhibit 1. Installed Wind Capacity Falling Below Government Target SOURCE: BWE
The wind energy business in Germany has stalled. In 2016, 4,625 megawatts (MW) of new wind capacity were installed, and in 2017 capacity grew by 5,334 MW. Those volumes are the equivalent of 4-5 large coal-fired power plants. In 2018, newly installed wind capacity declined to 2,402 MW, and the following year it dropped further to only 1,078 MW. There was a slight rebound last year, as 1,431 MW of wind capacity was installed. The problem is that Germany’s target for new wind power capacity is 2,800 MW per year, so the average of the five years 2016-2020 is barely above that target. The last three years, however, are well below the target.

Exhibit 2. Number Of Wind Turbines Installed Is Declining As Removals Grow SOURCE: BWE
This brings up another trend that is beginning to challenge Germany’s wind energy, and renewables overall. That is the issue of wind turbine retirements. As the nearby chart shows, the number of wind turbines installed surged in the early 2000s, followed by another surge around 2015. But as many of those turbines installed in the early 2000s reach their economic limit (subsidies end and they are uneconomic to continue to operate) and physical life, the number of turbines being removed will increase. The projections call for 6,000 turbines to be removed over the next five years, or an average of 1,200 turbines per year. That means more turbines will be removed than were installed in the years 2018-2020, and likely this year, too. As the line in the chart marking the cumulative total of wind turbines shows, the number of turbines has been essentially flat since 2017. Based on market projections that line will be turning down, signaling a challenge for the wind industry to grow its generating capacity even though new turbines have greater capacities than many of the earlier ones. This reality is why all the politicians vying for leadership role in the upcoming September German general elections are calling for a “speed up in the roll-out of renewables.” The new CEO of Germany’s largest energy company RWE, Markus Krebber, expressed hope that the next Germany government will clear the hurdles hampering the rapid expansion of renewable energy sources. “Above all, we urgently need more space for the construction of wind turbines, not only at sea, but also on land,” he warned. The German government is also offering payments to neighbors of wind turbines to compensate them for the noise they make, in trying to buy off the growing opposition to wind farms.
According to The Wall Street Journal, in an article a week ago last Saturday, coal prices recently reached a decade high. Let that sink in for a minute. Coal prices are now the highest they have been since 2011. This at a time when coal is being phased out of energy supplies by many countries. According to the International Energy Agency (IEA), global coal consumption declined between 2010 and 2020 by 114 million tons (Mt), or roughly 2%. On the other hand, between 2010 and 2018, the share of global power generated by coal rose from 33% to 36%, but its share fell in 2019 and was sharply lower in 2020, as the pandemic crushed power demand due to economic lockdowns. The latest IEA coal report forecasts slightly over a 1% increase in coal consumption this year, in response to a rebounding economy.

Exhibit 3. How Coal Prices Are Climbing In Europe SOURCE: WSJ
The problem has been that the early portion of this year has brought significantly colder temperatures to Germany. The government’s plan for shutting down its nuclear and coal generating plants in favor of expanded renewable energy has played havoc with Germany’s electricity market. At the start of 2020, Germany shut down its Heyden coal-fired power plant located near Petershagen, in the northeast corner of North Rhine-Westphalia, which borders on the Netherlands. The plant began operations in 1987, but the site of the plant has been used for power generation since 1950. The plant, with a capacity of 920 MW, is the largest coal-fired plant in Europe. It burns 265 tons of coal per hour and is served several times a day by rail, or by ship from all over the world to its own dock on the river Weser to be stored on site. The plant traditionally has stockpiled a month’s supply of coal.

Exhibit 4. Germany’s Heyden Coal-Fired Power Plant Is Largest In Europe SOURCE: Photo: ChristianSchd, CC BY-SA 3.0
Between January and February 2021, the Heyden plant had to be restarted six times to meet the nation’s power needs, even though it had been officially shut down because of Germany’s Energiewende green energy transition plan. In early April, the Heyden plant was reclassified from “shut down” to "spinning power," suggesting that power planners anticipate the need for more immediate standby power for those times when renewable power fails.
The lack of wind for multiple days, as well as cloudy days wiping out solar power’s contribution to Germany’s electricity supply, has forced utility managers to rely increasingly on previously shut-down power plants like Heyden, as well as older lignite plants, burning the dirtiest coal, to keep the lights on. To appreciate how variable the weather has been so far this year, the following chart (next page) showing power production by fuel daily for the entire month of May illustrates our point.
To help the reader, we note, starting from the bottom of the chart, the green and yellow represent biomass (wood) and nuclear. Those are consistent except for very brief periods when nuclear output was reduced. The dark brown represents lignite, followed by white for other fossil fuels, and dark gray for hard coal. Orange is natural gas, with light blue representing hydropower. The red is for solar power, which is highly variable as reflected by the differing heights of the output and some narrowing due to solar being generated for fewer hours a day. The dark blue is for onshore wind, with the lighter blue representing offshore wind.

Exhibit 5. Germany’s Power By Fuel During May 2021 SOURCE: Energy Brainpool
When viewed as one mosaic, the variability of wind and solar becomes very clear. Offsetting renewables’ variability has been output from lignite and natural gas power plants. As we see from the chart, there were several days both at the beginning and end of May when wind power was virtually non-existent. There was also a 10-day stretch from June 11 -21 when wind was only a small contributor. When we realize that Germany has led the European Union in adding renewable energy to its electricity generating capacity, the absence of wind and solar force a scramble to find alternative power supplies. Germany, like other leading states and nations in the race to add renewable power to their grids, relies on imports of surplus power generated from neighbors. That works unless those neighbors have similarly constructed grids, meaning they do not have the surplus power to sell to their neighbors. This was the case recently in California during its heat wave, as well as in the U.K. when its wind power supply collapsed. It is also worth noting that the Heyden plant went into “spinning mode” in April, which made its power available to Germany’s grid. That change in status also meant that there would be no additional incidents of having to restart Heyden.
As the chart showed, natural gas also supplied power to cushion the absence of renewable power. However, due to the colder than normal winter months in 2021, natural gas supplies were drawn down, putting upward pressure on gas prices. The WSJ article contained a chart (next page) showing Europe’s natural gas storage for 2020 and 2021 year to date, along with the average for 2016-2019. Rather than provide dates along the x-axis, the scale is the number of days during the year. What it shows is that 2021’s gas storage was tracking the 2016-2019 average until about day 90, which would be the end of March. From that point forward, storage volumes fell below the historical average until after 120 days, or the start of May. At that point, storage began to build.

Exhibit 6. Low Gas Storage In Europe Triggered Price Hike SOURCE: WSJ
While we highlighted the Heyden plant, there were three other coal-fired power plants – Datteln (303 MW), Walsum (600 MW), and Westfalen (850 MW) – that the Federal Network Agency has reclassified as system-relevant and must remain in “spinning” status. All four plants are large. Their size is necessary to provide the rotational energy (run at full speed but not feed any power into the grid) required to bridge the time necessary for medium- and peak-load power plants to deliver the missing renewable power to the grid. Of course, this is a highly inefficient and costly way to operate a power plant, which must be borne by customers.
The owners of these plants have the cost for operating the facility and its maintenance, while earning practically no income, since bridging supplies are needed only for seconds and/or minutes when net frequency dips below the current feed range. Therefore, these plants need to be subsidized. This a paradoxical situation because, in the past, these power plants generated the cheapest electricity to date and managed to produce it without subsidies. Now they deliver costly power, which is why Germany has the most expensive electricity in the world. It also is seeing its consumption of coal and lignite soar. Argus Research projects that Germany’s consumption of coal-fired power will increase by 35% in the first half of 2021 compared to the same period last year.
According to Statista, in 2020, Germany had the most expensive wholesale power at 36 cents per kilowatt-hour (kWh), followed by Denmark at 33 cents/kWh, another country heavily dependent on renewable power.The U.K., which is aggressively installing onshore and offshore wind power, ranks seventh at 26 cents/kWh.The United States was 19th, with a power price 21 cents/kWh cheaper than Germany’s price. Also, Handelsblatt, a German business daily, reports that electricity bills for German industrial companies have doubled since March 2020 to June 2021, from €35/MW-hour ($41.50) to €70/MW-hour ($83.02).
What does all this mean for power plant operators? We turn to the WSJ for a chart showing the profit margins for Germany power plants by fuel. What the chart shows is that during 2020, power plants made money when fueled by natural gas, but lost money when burning coal and lignite. As winter arrived, gas margins fell and coal and lignite margins rose, but plants were unprofitable overall. Money was made with all three fuels at the end of 2020 and start of 2021. Then, coal and lignite margins collapsed. Although natural gas suffered less, it was still negative. Recently, margins for all fuels improved, but lignite margins have soared into profitable territory.

Exhibit 7. Lignite Profit Margins Have Soared Recently SOURCE: WSJ
Equally surprising is that the European Union’s carbon offset market prices also soared while coal prices were rising. This is contracyclical as high offset prices should limit demand for coal, which produces twice as much carbon per unit of electricity than natural gas. Lignite is also a greater contributor to carbon emissions than hard coal. The explanation for the simultaneous increase in offset prices and coal prices is because natural gas prices and electricity prices have also risen. In other words, as the cost of fuels and power prices rise, they force power generators to emphasize the cheapest fuel in relative cost terms. That strategy is why utilities are boosting coal and lignite use over natural gas.

Exhibit 8. EU Carbon Offset Prices Are Soaring SOURCE: Wikipedia
The dilemma Germany faces, or more appropriately its electricity customers face, is what happens to power prices and with blackouts beginning in 2022 when more coal and lignite power plants are to be shuttered, along with the closing of the remainder of the nation’s nuclear power plants. These closures will remove 1.5 gigawatts (GW) of capacity from the grid, capable of generating about 3% of total electricity needs. Furthermore, approximately 6,000 wind turbines, with an installed capacity of 16 GW, will be dismantled in 2022 due to the expiration of their feed-in subsidies, i.e., they are no longer economic without subsidies. These turbines generated approximately 7% of total electricity demand in 2020.
The addition of new green energy plants will not come close to offsetting this lost generating capacity. If electricity demand returns to pre-pandemic levels, then the outlook for meeting winter power needs will be iffy. The capacity shortfall would be between 10% and 15%. A severe winter, or extended periods of no wind and limited solar could send Germany into rolling power blackouts, or worse. This outlook may result in even more coal power plants being restarted or delaying the shutting down of the capacity scheduled to be closed. What unintended consequences might come with this scenario? How much might it cost customers?
Despite EU and politicians across European countries demanding coal be eliminated from the continent’s power mix, the realities of meeting customer needs, and at the least cost, is forcing utilities to rely increasingly on coal and lignite. This scenario should not be surprising, except to environmentalists who fail to understand the laws of physics. The rush to decarbonize economies needs greater thought and planning, to avoid more power blackouts, about which utility companies are sounding warnings. Customers may also face soaring power prices. The green energy revolution may prove more harmful than beneficial for citizens.
Scarcity To Plenty – What Really Drives Oil Markets
Peak Oil. Does anyone remember when it was feared the world was about to run out of crude oil production that would cause oil prices to skyrocket and consumers to ration its use? The resulting scenarios were scary. The peak oil movement became high-profile in the early 2000s, when the oil market was spooked by an explosion in demand, as China’s buildout in preparation for its upcoming Olympics lifted consumption. Crude oil prices began climbing, and predictions called for ever higher prices. A skeptical public focused on Saudi Arabia and its claim to be able to ramp its oil production substantially higher to overcome the fear of physical oil shortages. The height of the controversy arrived with the publication of Matt Simmons’ book, Twilight in the Desert, questioning Saudi claims of huge surplus productive capacity in reserve. His skepticism, and that of the Peak Oil movement, was based on an investigation of 200 petroleum engineering technical papers discussing output issues from the country’s oil wells.
The average WTI oil futures price during 2000-2003 was essentially flat ranging from the mid-$20s a barrel to $30. When the oil market began to understand that oil demand growth in 2004 would be materially above what had been predicted by the International Energy Agency (IEA), as well as other forecasters, oil prices began climbing. As the accompanying chart shows, the oil price climb was steady from 2004-2007 before jumping in 2008. Demand was growing, driven by a booming economy supported by low interest rates and a growing housing bubble. WTI averaged almost $100 a barrel in 2008. The $100 a barrel barrier was first breeched in February 2008, with oil prices remaining well above that threshold from March through the end of September. In July, WTI reached $145 a barrel, as Wall Street investment banks began projecting prices of $150 to $200 a barrel or more in the foreseeable future. Optimism about the impact of an imbalance between demand and supply began dominating the market’s thinking about the trajectory for oil prices.
Once the July oil price peak was reached and prices continued to go higher, oil prices began reacting to the fear of a global recession due to the financial market turmoil, slumping to a low of $35 a barrel by Christmas Eve, down 65% from the January 2nd starting point. Problems in the U.S. real estate and housing markets were mushrooming, setting off alarm bells around the world about an impending crisis crippling the global financial industry. Those fears were amplified when, in September 2008, the bankruptcy of the investment bank Lehman Bros. kicked off a global financial crisis. Financial markets collapsed, consumer confidence tumbled, economic activity downshifted, as did all commercial financial transactions, creating a global liquidity crisis that foreshadowed a global recession. That prospect sent oil demand and price forecasts crashing.

Exhibit 9. Oil Prices Began Climbing After China Demand Surprise SOURCE: EIA, PPHB
The 2009 recession ended quickly as central banks around the world slashed interest rates and injected substantial amounts of liquidity into the global banking sector to shore up the balance sheets of financial institutions to enable them to withstand the mortgage loan losses they were facing with the bursting of the housing bubble. Governments also aggressively stimulated economic activity by stepping up spending and easing financial burdens on companies and individuals. Most important was the restoration of liquidity in the international banking system, which improved business outlooks, as well as forecasts for a healthy economic rebound. Oil demand rebounded, and with more than a year of reduced capital spending by the oil and gas industry, forecasters and industry participants understood that supply growth would trail expectations leading to higher oil prices.
Oil prices did rally. By early 2011, oil prices were back above $100 a barrel and remained there until the start of summer. Prices then declined, and while they fluctuated, they did not return to the $100 level until 2013. From there, oil prices remained elevated through most of the first half of 2014, peaking at $107 a barrel on June 20, after which they began sliding, as global oil supply, pumped up by the success of the U.S. shale industry, began overwhelming demand forecasts. Thanksgiving 2014 brought the surprising announcement by Saudi Arabia that it would no longer support OPEC’s high oil price. In fact, Saudi Arabia cut its oil price and stepped-up exports to Asia to recapture market share it had lost to fellow OPEC members while it supported the organization’s elevated price in the face of weak fundamentals. The oil market changed that weekend and ushered in the era of “lower for longer,” a term coined by BP CEO Bob Dudley.
Following the collapse of oil prices at the end of 2014, they struggled to regain their lofty price, rising to an average of about $65 a barrel in 2018, only to fall back in 2019. Twenty-twenty saw the pandemic crush oil demand, as economies were locked down to fight the spread of the virus, sending WTI into negative territory for the first time ever. Today, we are in an environment of rallying oil prices, as economic activity grows and financial discipline by oil and gas companies, along with supply discipline by OPEC and its partner Russia, help tighten the global oil supply/demand balance.

Exhibit 10. WTI Prices Have Never Returned To Boom Of 2011-2014 SOURCE: EIA, PPHB
Over the last two decades, the Peak Oil movement, driven by fears of supply growth impediments, was replaced by peak oil demand concerns prompted by the climate change movement’s success in pushing to stop the burning of fossil fuels. The strength of the climate change movement, aided by investors embracing ESG (environmental, social and governance) metrics that penalize the fossil fuel industry, has created a new cottage industry of oil forecasters predicting when oil demand stops rising and starts declining. These forecasters are racing to top each other’s latest prediction of when oil demand drops to zero, even though that prospect is highly unlikely. In fact, the IEA, in its World Energy Outlook 2020, published late last year, calls for oil demand to recover from its devastation in 2020 and to surpass 2019 (pre-pandemic) demand by 2023, and then continue to grow, as shown in the chart. Despite the projected recovery, the IEA expects oil demand in 2030 to be two million barrels per day below what it projected in its 2019 report. The IEA also says that past 2030 oil demand will plateau. However, the IEA says nothing about oil demand subsequently declining.

Exhibit 11. Renewables Use Projected To Soar In IEA Outlook SOURCE: IEA
What is very interesting is the oil component of final energy consumption in the various policy scenarios the IEA prepared in its Net Zero by 2050: A Roadmap for the Global Energy Sector issued recently. We have taken two charts from that report – one showing energy demand to 2050 by fuel under its STEPS (Stated Policies Scenarios) scenario, with the other comparing historic demand growth and projected growth under the STEPS and APC (Announced Pledges Scenario) scenarios.
What we see under STEPS is that only in the buildings sector does oil use decline during the forecast period. On the other hand, industry oil consumption increases, primarily driven by increased petrochemical output. As the IEA has pointed out, in the past, 60% of oil demand growth came from the transportation sector, while in the future it sees 60% of the growth coming from petrochemicals. We also see oil use in transportation rising slightly compared to 2020, but it is measurably below the volume consumed in 2010.

Exhibit 12. Oil’s Share Continues Up In Industry And Transportation SOURCE: IEA
While oil demand under STEPS increases slightly between 2030 and 2050, under APC there is a noticeable decline. The latter projection assumes all the pledges by countries to reduce emissions are honored, which is what drives demand down. The point is that even under the most stringent environmental restrictions outlined so far, oil will remain a significant component of the world’s energy mix in 2050. This is the predicate for why the IEA issued its Net Zero report to show a roadmap for how the world could reach a net-zero carbon emissions target, as it recognizes that the world cannot meet the target based on current assumptions and emissions reduction pledges.

Exhibit 13. It Does Not Matter The IEA Scenario – Oil Still Important Fuel SOURCE: IEA
A recent report by two economists – Christof Rühl and Tit Efker from the Harvard Kennedy School ‒ examined the relationship between oil and gross domestic product (GDP). The paper was the subject of a webinar by the Baker Institute Center for Energy Studies at Rice University. The authors point out that oil remains the largest primary fuel in the world’s energy mix, a position it has held since 1964. Global oil consumption continues to rise in absolute terms. That growth has been at 6% per year since 1870 (when records began), 1.2% per year since 1973, and 1.6% over the last ten years. Oil’s global market share, however, has fallen from 50% in 1973 (when its share peaked) to 33% in 2019 and continues to decline.

Exhibit 14. How Oil’s Role In Global Economy Has Changed Over Time SOURCE: Rühl
What we have learned over the years is that demand is inelastic with respect to price changes in the short-term. What is also interesting is that global oil intensity has declined steadily since the 1970s. From 1984, when the OPEC oil price war was launched, the decline in oil intensity has been linear. That relationship during 1984-2019 has an R2 correlation of 0.9943, which is extremely high, signaling how consistent the annual decline in volume has been, regardless of market conditions.

Exhibit 15. Global Oil Intensity Trends In Economy Over Time SOURCE: Rühl
The authors point out that oil intensity rose during the years after World War II, with oil’s share in the global energy mix rising rapidly. The fuel’s competitive relative price, based on its superior energy density and convenience factors, resulted in oil being substituted for other fuels, primarily coal, in power generation and home heating. The expansion of the global transportation market, as the automobile age began, further helped boost oil demand. To appreciate how the relationship between global oil intensity and real oil prices change over time, see the following chart.

Exhibit 16. How Oil Intensity And Oil Price Trends Differ Over Time SOURCE: Rühl
What the chart shows is how oil intensity rose while real oil prices were stable up until the early 1970s. When prices exploded during the 1970s, oil intensity began to decline, as investments were made in capital equipment to reduce energy consumption and new technologies emerged that needed less oil. What is surprising is the steady decline in oil intensity continued during the 1990s and all through the 2000s, despite the sharp increase in real oil prices beginning in 2003. The authors concluded that as income levels rise over time, the share of oil used in final consumption, and therefore in single fuel appliances, increases. Therefore, oil price elasticity declines. This trend has been evident since 1980.

Exhibit 17. Oil’s Primary Energy Share Versus Share In Final Consumption SOURCE: Rühl
As the authors conclude:
In this reasoning, as the lion’s share of oil consumption shifts toward final consumption, the increased efficiency of end-user devices will eventually slow the growth of oil in the economy; the dwindling options for fuel substitution will stabilize the share of oil in the fuel mix; and both lower the price elasticity of oil. Oil consumption growing faster than GDP (oil intensity rising), then GDP growing faster than oil intensity falls (intensity improvements combined with positive oil demand growth) and finally, the point from which the intensity decline starts to outpace GDP growth and oil demand starts to decline – these have been the thresholds oil intensity had to cross in regions where the full process has already played itself out. (Emphasis added.)
This conclusion drove the authors to examine oil intensity measures in the three major consuming markets – China, the European Union, and the United States. Not surprisingly, the three regions showed similar declines in oil intensity. This has implications for where oil demand is heading.

Exhibit 18. Oil Intensity Is Converging For Major Economies SOURCE: Rühl
A point was made that the rise of the service sector decreases primary energy intensity. This is due to changes in the economy’s capital stock. Additionally, with this shift, oil demand growth becomes less sensitive to price changes. (The authors point to this issue when thinking about the universal assumption that implementing carbon pricing or taxation will cut oil demand.) The point is that those price-induced oil demand changes may be muted now because of the structural changes within economies. As oil’s share of the global energy market declines, this also reduces the power of OPEC to influence prices. There is also the reality that the lower share of oil in the economy will lessen the impact of higher oil prices on inflation.
For the authors, these industry and economic dynamics will lead to a peak in oil demand and then a decline. In the presentation about the paper and its model, Mr. Rühl presented several forecasts based on the historic oil intensity decline rate for 2009-2019 and then one adjusted for economic impacts from the Coronavirus. Oil demand could peak as early as 2026 at 98.5 million barrels per day (mmb/d) or as late as 2036 at 110 mmb/d.
In the Q&A session, Mark Finley, fellow in energy and global oil at the Baker Institute Center for Energy Studies and moderator of the program, asked Mr. Rühl and the other two presenters, Sarah Emerson, president of ESAI Energy, and Dean Foreman, chief economist of the American Petroleum Institute, to give a date for the peak in global oil demand. The three predictions fell within the window of 2030-2033.
In this discussion, we must keep a focus on the reality that world oil production has grown to meet rising global demand, despite declining oil intensity. When we look at the 1965-1984 period, we can see how the early phase of declining oil intensity took its toll largely on OPEC output, as consumers initially depended on it for supply, but then shifted away when more stable, western oil supplies became available. When Non-OPEC production resumed growing in the mid-1990s, both global oil supply sources were necessary to meet demand. Now it appears the world has adequate oil supplies to meet current demand, but as OPEC spare capacity declines and Non-OPEC supply growth flattens, higher prices will become key to controlling demand growth.
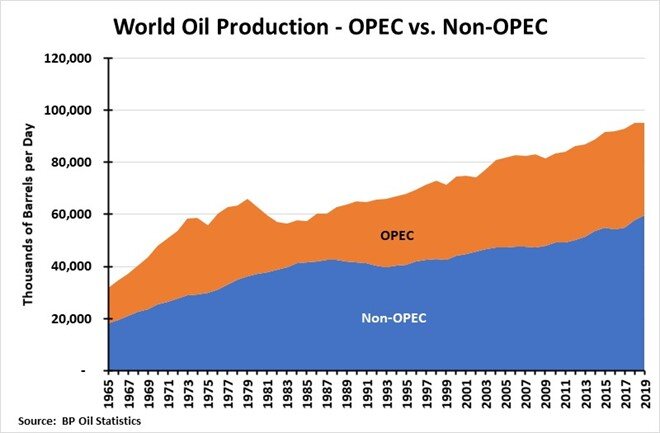
Exhibit 19. World Oil Production Grew To Meet Demand SOURCE: BP Oil Statistics, PPHB
The key conclusion from the paper’s model and the discussion was that there will be a peak in global oil demand sometime in the future, but that date is more than a decade away. Moreover, the peak will be driven by structural relationships within the global economy and its use of oil that have been at work for decades and not from climate policy. Might climate policy accelerate the date when oil demand peaks? Yes, but as mentioned earlier, and commented on by the presenters, due to oil intensity declining, the pricing or taxing of the carbon in oil, which appears to be the primary thrust of government control, may have little impact on the pace of reaching oil’s demand peak. This is a surprising conclusion and bound to disappoint environmentalists and politicians, but it probably will not deter them from pushing carbon taxes and restrictions on using oil. The reality is that the pattern of the oil intensity trend and oil consumption is how energy transitions have occurred in the past ‒ a natural evolution of economies and the fuels that power them. All is not bleak for the oil and gas industry, however, ignoring this trend will be a huge mistake.
Solar Promise Faces Cost And Supply Chain Issues
Solar power installations are exploding according to the latest data from the Solar Energy Industries Association (SEIA), reported in cooperation with its partners at Wood Mackenzie Power & Renewables and The Solar Foundation. Solar power has accounted for either the largest or second-largest share of new electricity capacity additions for the past eight years. Last year, 43% of all new electricity generating capacity was solar, the largest share in history and the second year in a row that it claimed this title. The driver for this growth is solar power’s increasing competitiveness against other energy technologies. As a result, the solar share of U.S. electricity generation has grown from 0.1% in 2010 to over 3% in 1Q 2021. Solar is described as having a bright future (pardon the pun).

Exhibit 20. Solar Power Installations Have Taken Off In Recent Years SOURCE: SEIA
As the accompanying chart shows, while all types of solar have grown over the past five years, the most significant growth has been in the utility sector. For residential solar, growth appears to have stalled. It was growing at a more rapid rate between 2014 and 2016, but then slowed until 2020, at which point the rate of increase slowed further, probably hurt by the Covid-19 virus and economic lockdowns.
The growing dominance of solar versus other energy sources was demonstrated in 1Q 2021 when solar accounted for 58% of installed capacity with wind representing the balance. As a result, forecasts call for solar installed capacity to reach 19 gigawatts (GW) in 2021, up from 13 GW in 2019.

Exhibit 21. Solar, Along With Wind, Is Dominating Newly Installed Generating Capacity SOURCE: SEIA
The reason for solar power’s success is that it has benefited from years of falling costs, primarily due to China’s desire to dominate and control the global solar market. Briefly, Germany led the push for solar and exceeded its manufacturing capacity when it provided significant financial incentives for citizens to install solar panels. Desperate for panels, consumers were forced to go to China, which stimulated expansion of that country’s manufacturing capacity. As part of China’s long-term industrial strategy, it targeted the new energy markets as growth opportunities where the country’s cheap labor, control over key raw materials, and low-cost energy allowed its manufacturers to control these markets. Solar panels became a key market opportunity for China, and its scale led to sharply lower unit costs, which also stymied further research and development to improve panels. With price becoming the key market dynamic, no country could effectively compete with China.
Recently, the Biden administration has taken on China’s solar industry by banning imports of silica-based products made by Hoshine Silicon Industry Company, as well as goods made using those products. The ban is in recognition of the use of forced labor in the supply chain for solar panels made in the Chinese region of Xinjiang. A significant portion of the world’s polysilicon, which is used to make solar panels, comes from Xinjiang. The U.S. government also added four other Chinese companies to a trade blacklist, meaning that U.S. companies cannot export products and/or technology to them.
While commercial action against China and some of its companies engaged in repression of Uyghurs and other Muslim minorities is a popular human-rights move, it will potentially impact the global solar panel industry, and the pace of solar installations in the United States. The latter impact would go against the policy plans of the Biden administration with respect to its effort to decarbonize the nation’s electricity system.
China is the dominant global producer of polysilicon, a raw material that most solar panels use to absorb energy from sunlight. Over the past decade, Xinjiang become China’s main production base for the material, supplying about 45% of the world’s polysilicon, according to InfoLink, a renewable energy research firm. While the U.S. government ban targets only one company and not all polysilicon products from Xinjiang, Hoshine and its subsidiaries supply at least some metallurgical-grade silicon to the world’s eight largest polysilicon producers, which together account for 90% of the global market, according to Bernreuter Research. In other words, nearly every solar panel supplier may be tainted and subject to business setbacks. The impact, like what is being experienced in the raw materials necessary in the wind turbine market, is that solar panel manufacturing costs may be heading up. That will likely result in solar companies having to raise prices, inflating the cost of producing solar power. So, will the yellow price curve in the accompanying chart begin to rise after 2021?

Exhibit 22. Are Solar Price Declines About To End? SOURCE: SEIA
With respect to residential solar systems, we have seen little cost improvement since 2017. Hardware costs have been flat since 2017, but that may be changing in the future if the polysilicon ban forces adjustments to the supply chain. Residential soft costs - installation labor, customer acquisition, and permitting/inspection/interconnection expenses – have been fairly-stable since 2017, as demonstrated by the line showing their share of total system cost. One wonders how long this stability can be maintained.

Exhibit 23. Residential Solar Pricing Seems To Be Flatlining SOURCE: SEIA
An interesting trend we noticed when looking at SEIA’s recent report was what has happened to solar employment. According to the chart (next page), employment in the industry peaked in 2016. Since then, the number of workers in each category has declined. What has limited the overall decline is the introduction of the Operations and Maintenance category beginning in 2018. For an industry supposedly in a growth mode, the employment trend is puzzling. Our explanation is that the industry’s workers have become more productive, as well as systems getting larger. The employment trend, however, goes against the argument made by the Biden administration that by emphasizing the renewables industry, it will create millions of well-paying union jobs.

Exhibit 24. Solar Employment Peaked In 2017 – Why? SOURCE: SEIA
The latest issue for solar came from a paper recently published by the Harvard Business Review. It dealt with the issue of disposal of solar panels. The authors wrote:
Economic incentives are rapidly aligning to encourage customers to trade their existing panels for newer, cheaper, more efficient models. In an industry where circularity solutions such as recycling remain woefully inadequate, the sheer volume of discarded panels will soon pose a risk of existentially damaging proportions.
The authors go on to examine how the forecasts for solar panel waste are woefully under-estimating the changing industry dynamics, which are cited as driving the strong growth in solar installations. Costs of panels and their performance life are improving. Those improvements lead to questioning the assumption in forecasts that currently installed systems will not be replaced before the end of their 30-year life. Based on real U.S. data, the authors modeled the incentives affecting consumers’ decisions whether to replace their existing systems under various scenarios. The three variables they identified influencing replacement decisions were: installation price; compensation paid (the going rate for solar energy sold to the grid); and panel efficiency. The authors’ conclusion was that if the cost to replace was low enough and the efficiency and compensation high enough, the greater net present value of a new system will cause people to replace their systems prior to the full 30-year life. As they also point out, although their modeling only involved residential systems, with commercial and industrial systems, the replacement issue will grow significantly. Why will this replacement cycle grow? Because solar system owners earn income from selling the output, as opposed to virtually every other clean energy application.
The study concluded that if the early replacements occur as predicted by the authors’ statistical model, there could be 50-times more waste generated in just four years than predicted by the International Renewable Energy Agency (IRENA) forecast. The lack of an adequate solar panel recycling industry becomes the critical issue. (The study’s authors are all professors focused on environmental sustainability.)
The authors indicated that First Solar is the sole U.S. solar panel manufacturer with a recycling initiative, but which is limited to its own products. It is gearing up this business to a two-million-panels-per-year volume. At the current capacity, it costs an estimated $20-$30 to recycle one panel. Taking a panel to a landfill would only cost about $1-$2.
The recycling process is only one part of the end-of-life challenge. Because panels are delicate and bulky pieces of equipment mounted on rooftops, specialized labor is needed to remove them to prevent their breaking up in the process. Some governments classify used panels as hazardous waste, due to the small amounts of heavy metal (cadmium, lead, etc.) they contain. Such a classification adds to the restrictions on their removal, transportation, handling, and disposition.

Exhibit 25. Solar Waste Model Signals Problem For The Industry SOURCE: Harvard Business Review
What this means is a meaningful cost burden for the industry. The authors suggest that “the totality of these unforeseen costs could crush industry competitiveness.” They plotted future solar installations according to the logistical growth curve capped at 700 GW by 2050 (according to the National Renewable Energy Laboratory’s ceiling for the U.S. residential market) along with their early replacement curve. This produced a projection of waste volumes surpassing the volume of new installations by 2031. This would drive the levelized cost of energy (LCOE) for solar to 4-times its current projection. As the authors conclude, “The economics of solar – so bright-seeming from the vantage point of 2021 – would darken quickly as the industry sinks under the weight of its own trash.” That is certainly not an outcome the solar industry wishes to face.
The authors were involved in helping rewrite the European Union’s WEEE Directive, a legal framework for the recycling and disposal of electronic waste throughout E.U. member countries. Those U.S. states that have enacted electronics-recycling legislation have mostly followed the WEEE model. During the late 2000s rewriting of WEEE, a major issue became who was responsible for paying for the accumulated waste generated from companies no longer in existence ‒ so-called orphan-waste. These questions will need to be addressed as the solar industry looks forward to handling its waste.
The authors point out that this is not just a solar panel industry issue. It is also a wind and electric vehicle (EV) industry challenge. Estimates are that more than 720,000 tons worth of wind turbine blades will end up in U.S. landfills over the next 20 years. According to estimates, only 5% of EV batteries are recycled, something the auto manufacturers are struggling to address, as forecasts for the number of EVs grows. As was pointed out, the solar industry challenge is potentially greater because solar represents a revenue-generating investment for consumers, which could drive a significant early and large disposal cycle.

Exhibit 26. What Happens To Clean Energy 2035 If Solar Does Not Accelerate? SOURCE: SEIA
With solar projected to play a significant role in the decarbonization of the U.S. electricity system, it is already lagging what is necessary to achieve 100% clean energy by 2035. In fact, as Wood Mackenzie estimates, by 2031 the U.S. will need to install annually more than 100% of what solar capacity has cumulatively been installed as of 2020 to meet the 2035 goal. This is another example of market projections, made to satisfy environmentalists and politicians, clashing with physical and financial reality. With polysilicon supplies being jeopardized by human rights concerns and the cost of solar panel waste, which may accelerate faster and cost much more than has been considered, yet to be factored into solar economics, one wonders just how fanciful all the solar projections will prove to be?
Thoughts On Current Energy Market Issues
Oil and Gas Pipelines In The News – Implications for Infrastructure
Last week, the U.S. Supreme Court issued an opinion overturning the Third Circuit Court’s ruling in the PennEast v New Jersey case that upheld the state’s right to prevent the pipeline from using eminent domain to access state land for construction of the pipeline. The Supreme Court’s 5-4 decision, which saw mixes of conservative and liberal judges on each side of the ruling, protects a long-held right of pipelines approved by the Federal Energy Regulatory Commission (FERC) to be able to condemn land needed for constructing the pipeline, even state land. We will not debate the constitutional issues involved – state sovereignty versus federal powers transferred to private interests – but we believe this decision, beyond its significance for the construction of future oil and gas pipelines, may also have implications for the green energy revolution.

Exhibit 27. PennEast Pipeline’s Planned Route SOURCE: eenews.com
It is important to remember that FERC is involved in the siting decisions for power transmission lines. That role has evolved over the years, but in 2005, FERC was granted “backstop” authority in legislation passed by Congress. We will skip the mind-numbing history of electricity regulation since the creation of the Federal Power Commission in 1930, which eventually transitioned into FERC, other than to say that the federal government has become more involved in what used to be the purview of states. A 2010 paper from a legislative attorney with the Congressional Research Service ‒ “The Federal Government’s Role in Electric Transmission Facility Siting” ‒ helps explain the issue. It concluded:
Traditionally, the federal government has had a limited role in electric facility transmission siting, as siting decisions have in large part been made by state agencies. However, in recent years there has been a push to expand the federal role in transmission siting. The Energy Policy Act of 2005 created a “backstop” siting authority for FERC in certain instances where grid congestion was a concern. Recently there have been suggestions and legislative proposals that would further expand the federal role in electric facility transmission siting. Legal precedent suggests that federal involvement with transmission siting would likely pass constitutional muster, assuming a connection to interstate commerce is shown.
While siting above ground power lines is not quite the same as underground pipelines, we can envision similar pushback from states over siting issues. At least one major multi-state transmission line dedicated for renewable power was sidetracked by the rejection of the route by one state the line would cross. New Hampshire has rejected a clean power line to serve Massachusetts.
The PennEast ruling would appear to strengthen the case for federal involvement in energy infrastructure siting and the granting of authority for private companies to access not only private land, but state land also. While anti-fossil fuel proponents are upset with the recent Supreme Court decision, one day they may relish how that decision helps their cause when confronting states opposed to renewable power transmission lines.
Current Heat Wave Triggering Rolling Blackouts And Warnings
The recent heat wave in the Pacific Northwest caused utilities in that region to either issue warnings about the possibility of rolling blackouts or actual institute blackouts. The record high temperatures in some localities have generated record demand for electricity, challenging utility generating capacities. Similar power supply warnings have also been issued in the New England region, as well as in New York, where the recent shutdown of the Indian Point nuclear plant has reduced the state’s assured power supply. The rolling blackout warnings in these various regions were like those issued by California and Texas early in June when record heat arrived.
The heat domes that have engulfed the regions have highlighted the risk of building electricity systems based on significant shares of power coming from renewables, without adequate backup dispatchable power. We can attest to the temperatures in New England, as Rhode Island was in its first heat wave of the year (temperatures over 90º F for multiple days) last week. Last Wednesday, we had to drive from our summer home in Charlestown, on the coast of Rhode Island, to Bradley International Airport, inland near Hartford, Connecticut. When we left our house, the outside temperature reading in our car registered 90º, but it reached 104º as we neared Hartford. Significantly, we noticed flags, as well as leaves on the trees, hanging limp. In other words, there was no wind – a phenomenon often accompanying high pressure, high temperature weather conditions.
Robert Bryce, during his podcast discussion with Meredith Angwin, author of Shorting the Grid: The Hidden Fragility of Our Electric Grid, commented that during the recent Texas heat wave, when ERCOT, the state’s grid operator issued a plea for power conservation, wind output dropped to 600 megawatt-hours (MWh) at one point out of a generating capacity of 35,000 MW. Essentially there was no contribution from wind turbines, meaning the grid was forced to rely on solar during the day, and nuclear and fossil fuel 24 hours a day. This is another example of the risk of depending on renewables without substantial dispatchable power supplies being available. (We recommend Mrs. Angwin’s book for those interested in understanding the challenges our electricity grids are facing, as they deal with increased renewable energy, a situation projected to worsen.)
Following a two-year process of shutting down New York State’s two Indian Point nuclear generating units, the environmental situation in the state has worsened.In the month following the shutdown of the last unit in April, an analysis by Environmental Progress found that Indian Point’s share of New York electricity was completely replaced by fossil fuels, with the share of New York’s generation from fossil fuels rising by 14 percentage points, from 30.5% to 44.5%, between 2019 and 2021. Over the same period, the nuclear share declined by 12 percentage points, from 38.7% to 26.5%. New York’s clean energy effort was further hampered by a two-percentage point drop in the share of power from hydroelectricity. The result was that New York’s share of electricity generation from fossil fuels was the highest it has been since 2016. More importantly, the state emitted 37% more carbon dioxide from electricity generation on an absolute basis.

Exhibit 28. Closing The Indian Point Nuclear Plant Hurt New York’s Environment SOURCE: Clean Power Professionals Group
We are guessing that New York Governor Andrew Cuomo, who personally targeted the closing of Indian Point in his election campaigns and governing, cannot wait for the huge offshore wind farms he was counting on to be built. He will have to wait for a few more years, however, as these farms are only in the early stages of approval from the federal government, let alone being constructed. Gov. Cuomo’s idea was for these wind farms to provide the replacement power for what would be lost by closing Indian Point. Idealism and realism clashed. Those who will suffer are the residents who are threatened with the need to cut their power consumption and/or face rolling electricity blackouts.
Additionally, residents will face higher utility bills. Statewide, New York residential electricity prices for the first three months of 2021 compared to the same period a year ago are 5.7% higher. From ConEd’s web site, the provider of power in New York City and Westchester (near where Indian Point is located), the company states that for residential customers using 300 kilowatt-hours a month of power, their bills this year will rise by 4.5% and 4.6%, respectively. We do not know how ConEd’s rates adjust with greater consumption volumes. However, those rates of increase are well above the Federal Reserve’s target for inflation to average 2%.
Leveraging deep industry knowledge and experience, since its formation in 2003, PPHB has advised on more than 150 transactions exceeding $10 Billion in total value. PPHB advises in mergers & acquisitions, both sell-side and buy-side, raises institutional private equity and debt and offers debt and restructuring advisory services. The firm provides clients with proven investment banking partners, committed to the industry, and committed to success.
