

Creating Energy Cycles: Could This One Be Different?
“While many people focus on the short-term cycles of the oil business, it is really important to examine what drives long-term cycles, given the long-term nature of the energy business. We examine the drivers behind long-term cycles and why things may be changing, making the next industry cycle different from the last one”
We have spent much of the past nine months wrestling with oil industry cycles. We began our study by examining the 2014 cycle, which was caused by the rapid increase in global oil supplies that overwhelmed the growth in demand. As oil supplies began outstripping demand, global oil prices started weakening in the summer of 2014. That price weakness unsettled many of the smaller members of the Organization of Petroleum Exporting Countries (OPEC) who began lobbying the organization’s kingpin, Saudi Arabia, to increase its support for the OPEC oil price marker. They pressured the Kingdom to cut its output to support OPEC’s oil price, something all the small country members were desperate to see upheld. A high price was crucial for their countries’ income.
Saudi Arabia was struggling with conflicting internal pressures. It had watched the green movement in Europe work to undercut the Kingdom by reversing the EU’s stand on banning Canadian oil sands output from entering the regional market. Up until late summer 2014, the conventional view was that environmentalists in Europe would ban Canada’s bitumen volumes based on their very high carbon content. The reversal of that expectation hurt Saudi Arabian heavy oil sales to Europe. That development created an additional global oil market where Saudi Arabia was losing market share to North American oil supplies.
Exhibit 1. Why Did So Many Miss The Start of This Downturn? SOURCE: EIA, Baker Hughes, PPHB
Faced with continual losses of market share, Saudi Arabia resorted to its trusted game plan of cutting oil prices and targeting additional supplies at regional markets where it wanted to rebuild its share, in particular, Asia. Reducing its oil price forced the Kingdom to reject the pressure from the smaller OPEC members to support higher oil prices. Cutting prices, boosting output and signaling it was going after lost market share were clear messages to the oil industry that the supply glut would continue to build in the near-term and that oil prices were headed lower. How low oil prices might fall was uncertain, as speculators often drive prices to extremes. The more important question, but also with an unknown answer, was just how long it would take for this cycle to play out.
In past Musings articles, we have covered how the 2014 downturn unfolded, which can be seen in Exhibit 1, prior page. While oil prices had already fallen by 32% at the time of the OPEC meeting in late November, where Saudi Arabia abandoned its oil price support, they collapsed into year-end and in the early months of 2015. By the time oil prices bottomed at $44.34 per barrel for West Texas Intermediate (WTI), the commodity had experienced a further 39% fall. The hand-wringing in the industry was intense. How could any company make money with oil prices less than half of what they were barely eight months earlier? That fear was amplified by oil prices having spent most of 2013-2014 in the $100 per barrel range, making people comfortable with high prices. No one could imagine the industry being profitable with oil priced in the mid-$40s.
After hitting bottom, the oil price bounced, much like the proverbial dead cat, and climbed to $60 before reversing course. That subsequent oil price slide, while briefly interrupted, continued until mid-February 2016, when WTI hit a low of $28.15, down 36.5% from its prior low, or an additional $16 per barrel haircut. Amazingly, after hitting that low, it was almost as if a switch was thrown and oil prices began a recovery that extended for nearly two and a half years, taking WTI back to $75 by mid-October 2018.
The drilling rig count had fallen steadily from the summer of 2014, interrupted by a very brief uptick, before reaching its cyclical low in late May 2016 at 404 active rigs. By the time the rig count bottomed, oil prices were already on the upswing. As expected, the oil price recovery spurred a rebirth in drilling. The rig count followed oil prices higher until prices peaked and then hit an air pocket that caused them to drop sharply before bouncing and then beginning to slide further. The peak in the drilling rig count shortly after the October 2018 oil price peak has not been seen since. The difficult 2019 oil price and drilling market was then blasted in March 2020 by the double black swans of Covid-19 and an OPEC oil war.
When the chart of the oil price and drilling rig count is examined as a whole, one can see a cycle having started in mid-2014 and ending in late 2018. Whether a new cycle started then, or didn’t begin until spring 2020, is debatable. This was at the heart of our article in the last Musings. Were we looking at just another short-term cycle that marks the industry’s history since 2000, and which tends to last five to eight years, or is it part of a long-term cycle that commenced when oil prices reached their highest level of the past 20 years in 2008?
Most oil industry cycles have been driven by imbalances between supply and demand, which doesn’t require huge imbalances to spark a cycle’s start or end. In some cases, the cycles are caused by disruptions in supply and demand due to geopolitical events. A key to the 21st century oil cycles seems to the volatility of oil pricing, which was analyzed by Robert McNally of Rapidan Energy Group, and was the subject of his book Crude Volatility: The History and the Future of Boom-Bust Oil Prices. The issue of oil price volatility is important, as crude oil is the single most consequential commodity price in the world. Controlling, or at least modulating, oil prices has been the elusive goal of producers, consumers and governments for well over a century, or since oil’s role in the global economy became significant. The boom-bust cycles of oil markets have challenged and perplexed everyone. However, for several periods in history, oil markets were relatively stable due to a controlling power.
Exhibit 2. Power Forces Needed For Oil Stability SOURCE: Robert McNally
When Mr. McNally wrote his book in 2016-2017, it was evident OPEC’s power in controlling global oil markets was waning, potentially ushering in an era of increased oil price volatility. In the book, based on a proprietary oil price database beginning in the 1850s he assembled, Mr. McNally studied price volatility in detail. The database led to him constructing the chart shown in Exhibit 2.
Unfortunately, the chart is very busy, making it difficult to grasp Mr. McNally’s point about the periods of oil price stability. Those periods existed from the 1930s to 1970s when the Texas Railroad Commission (TRRC) managed well output to prevent gluts that would destroy oil pricing and the industry’s economics. That effort was often helped by the Seven Sisters international oil companies who managed the concessions of Middle East oil producers. The second period of relative oil price stability was when OPEC assumed the mantle of control over global oil markets from the TRRC and managed global oil supply from 1970-2010. The initial years of each period was marked by increased price volatility, which is what led to tighter control by the regulating power.
Since 2010, the rise of U.S. shale oil and the growth of non-OPEC oil supplies began to weaken OPEC’s power. Concern over weak oil supply growth and accelerating oil demand propelled prices to over $100 a barrel. High oil prices created the expected response – greater exploration and more rapid development of shale resources. OPEC struggled to retain its grip on the global oil market. As the new supplies lay outside of OPEC’s control and were controlled by private enterprises. OPEC’s ability to control them was nonexistent. Their growth and projected trajectories complicated OPEC’s management of its own supply, which contributed to the market’s turmoil leading up to and immediately after Saudi Arabia’s action.
Oil’s role in world energy markets will remain significant for the foreseeable future, as it is the lifeblood of modern civilization. That is because transportation depends almost entirely on oil, and the transportation sector is vital for every other economic sector, from food supply to defense to industry and consumption. This is why almost every economic recession is associated with an oil supply/demand disruption. That is especially true in the current environment.
Naturally, oil prices are subject to booms and busts. The oil price volatility arises from very low supply and demand elasticities and limited storage. Oil is a “must-have” commodity for which there are no scalable substitutes, contrary to the view of “green energy” proponents. Bringing new supplies to market requires long lead-times and significant capital expenditures. However, once oil is flowing, operating costs are low and the expense to shut in output is high. Storage helps to smooth out temporary supply/demand imbalances, but it is not unlimited or costless. Producers have to balance all of these considerations in their supply management, and given the vagaries of the variables, the market balance often is upset. If the imbalance is more than the limited storage can handle - absorb too much output or release too much inventory to a supply-short market – then prices must adjust. The degree that markets are unbalanced signal the magnitude of the price adjustments necessary to rebalance the market.
While oil price volatility creates short-term industry cycles, long-term cycles are driven by the natural trends of population growth and economic activity. In general, both trends have risen steadily throughout history, with economic activity ebbing and flowing based on capital investment cycles. Capital investment is tied to monetary policies and the cost of money relative to expected returns on investments. There are changes underway in these key drivers, suggesting the future for oil may be different than its past. It is worth spending time on the broader trends and how they may be shifting, as we consider the long-term outlook for energy and crude oil.
Let’s start with population trends.
Exhibit 3. How World’s Population Has Grown SOURCE: Our World in Data
We see how global population has increased since 1950, but importantly how it has aged. There is little doubt that the world has become older over the past 70 years, but the ageing trends of various countries and regions have been quite different. Of greater significance is the projections for future ageing.

Exhibit 4. The Ageing Of The World’s Population SOURCE: UN, PPHB
What we see is the world’s median age, which has increased from the early 20s around 1970 to just over 30 years old now. The projections show a steady increase, albeit at a slower rate of increase after 2050, reaching the low-40s by 2100. The difference in the history and projections for ageing by regions of the world is noteworthy. Africa is barely at a median age of 20 years old, some 10 years below the world’s median, and much younger than every other region. Europe is the oldest region, and is projected to remain so until at least 2070, when it is overtaken by South America. What the projections show is the impact of the faster growth in Africa’s population relative to the rest of the world. It becomes clearer when we look at various country population histories and projections.

Exhibit 5. The Difference In Country Population Trends SOURCE: UN, PPHB
We selected 12 of the top 25 countries, ranked by 2020 populations, to see how they have aged and are projected to age further. While Japan is currently the oldest population, and likely to remain so for decades, it is only the 11th largest population. We have highlighted several countries – China, the United States, Pakistan and Nigeria (dashed lines) to demonstrate how populations will age. These countries will also become important in discussions about regional economic growth.

Exhibit 6. World’s Largest Populations And Data SOURCE: UN
The two largest populations in 2020 – China and India – represent 36% of the world’s total. They are markedly different in make-up and future growth, especially in the key measure of fertility. The fertility rate is the ratio between the number of live births in a year and the whole female population of childbearing age (average number of women between 15 and 50 years of age over the year). What we see is that China’s fertility rate is only 1.7, well below India’s 2.2 rate. A rate of 2.1 is considered what is needed for a stable population. A higher rate indicates a growing population, while a lower rate signals a shrinking population. There is already a 10-year difference in median age between the two countries, which reflects the different trends in fertility rates, something that takes a long-time to evolve and alter population growth rates.
When we consider Nigeria, Ethiopia, the Democratic Republic of Congo and Tanzania, with fertility rates from 4.3 to 6.0, one understands why Africa’s median age is so low and that it will rise slowly. When we show Nigeria’s median age, it becomes clear that it is very low and will remain so for decades.
There are other interesting contrasts involving China and India. The population density of China is only 153 people per square kilometer versus 464 for India, reflecting the significant difference in geographical size of the two countries. There is also a noticeable difference in urban density – China at 61% while India is at 35%. Those ratios contrast sharply with the United States at 83% and Brazil at 88% urban density. All of these differences will impact not only population growth but also economic growth, and in turn, oil and energy consumption.
Several studies have shown that energy use increases with ageing populations. That is contrary to what most of us assume, as we view older people as less active. We know they drive less, travel less, and tend to be more sedentary. In many cases, however, older people occupy homes that used to be occupied by more people, helping to reduce energy use per capita measures. When children leave and eventually spouses pass away, energy use per capita increases as the power needs for a home only declines at the margin with fewer residents. This pattern is not negated by the studies, but rather is used in the discussion of residential power consumption.
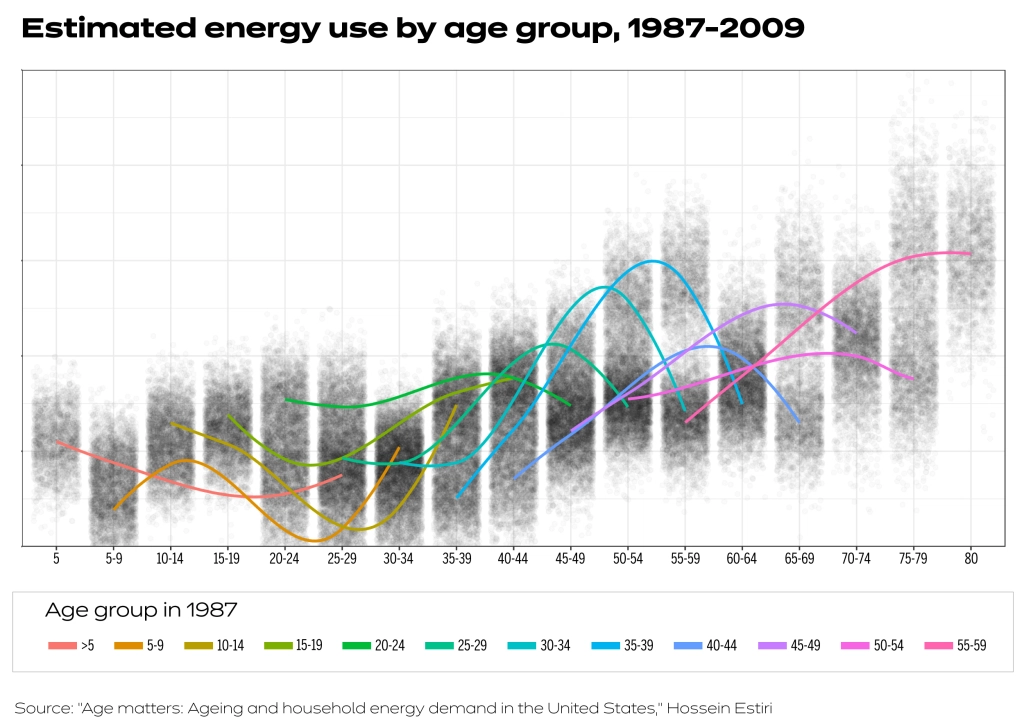
Exhibit 7. How Residential Energy Use Rises With Age SOURCE: Energy Research & Social Science
A researcher at Massachusetts General Hospital’s Laboratory of Computer Science, along with one from the Max Planck Institute for Demographic Research, co-authored a paper published in the journal Energy Research & Social Science examining how residential energy use changes over the human lifespan, as well as the impact from local climate changes. They concluded that we use more energy as we age, and that warmer temperatures can cause a spike in energy use among the elderly.
The study used new statistical methodology to extrapolate individual energy usage from the U.S. Energy Information Administration’s Residential Energy Consumption Surveys conducted in 1987, 1990, 2005, and 2009. They created and tracked “pseudo cohorts” by linking data from different age groups in each of the surveys. This enabled them to construct curves of people’s energy use as they age. The research showed that residential energy use climbs with age, starting when young adults leave the family home in their late teens or early 20s. Consumption remains flat until individuals reach their 30s and then climbs to a peak in their mid-50s, roughly coinciding with the end of family rearing. From 55 to 64 is another period of slow growth, with consumption increasing rapidly after age 70. This research is not surprising, as the study measured residential energy consumption, but is that true everywhere?
There will be a greater impact on energy consumption as economies experience faster economic growth, as well as rising living standards. This will be very significant in the developing countries of the world and in various regions of the world. For example, of the 25 largest populations, which accounted for 74.2% of the world’s population in 2020, Asia represented 48.6% of that total. Surprisingly, Africa represented only 8.1%. The key difference is that Africa’s population, at least in the countries with the largest populations and the highest growth rates, tends to be younger than Asia’s. Of the six African countries, four (Nigeria, Congo, Ethiopia and Tanzania) have populations with a median age of 17-19, while two (Egypt and South Africa) have median ages in the 20s. Those medians contrast with the world median age of slightly over 30 years old. African country fertility rates are much higher than those in Asia, as a number of countries in Asia have fertility rates well below replacement levels, signaling their populations are in decline.
With respect to economic growth, there are several factors to consider. We have plotted, based on World Bank data from 1961 to 2019, the annual change in gross domestic product (GDP) for the world, the OECD nations (developed economies), and East Asia & Pacific (representing the fastest growing region). What we see is a definite slowing of growth rates over time. In the 1960s and early 1970s, economic growth averaged somewhere around 6% per year. That trend slowed to only about 4% per year from the late 1970s to the 1990s. Since 2000, growth has slowed further to around 3% per year. In the case of the OECD, the annual economic growth rate has been closer to 2% per year since the Great Recession of 2008. For the United States, this time period marked the slowest economic recovery following a recession ever experienced.

Exhibit 8. GDP Growth Has Been Slowing Over Time SOURCE: World Bank, PPHB
What influences GDP growth, besides population growth? There are five other factors that influence the rate of economic growth. The six factors are:
Natural Resources
Physical Capital or Infrastructure
Population or Labor
Human Capital
Technology
Law
These six factors combine to help drive economic growth in an economy. Growth is reflected in an outward shift in its Production Possibility Curve (PPC), which is made up from estimates of total economic output when these six factors are combined. A country’s GDP, which is the total of all final goods and services produced within the country over a specific period of time, usually a year, may be along the PPC, or short of it, if one or more of the six factors is not being maximized.
The discovery of more natural resources like oil, or mineral deposits in a country may boost its economic growth, as it shifts or increases a country's PPC. In the same way, introducing a new technology or improving the education of the labor force can contribute to greater productivity of the labor component and boost a country’s GDP growth. The challenge in assessing the impacts of these factors is measuring their contribution. One factor that is thought easy to measure is changes in productivity (output per hour of work) in the nonfarm business sector. That measure has shown variability over time in all countries. We show its variation for the U.S.

Exhibit 9. History Of Labor Productivity Growth Is Lumpy SOURCE: BLS
A different picture of economic growth is shown when we consider the annual growth rate of real GDP per hour worked, especially across various nations and the developed economies as a whole (OECD). What is interesting is that in every market studied, except the United States, the rate of growth of real GDP per hour worked has been declining since 1971. That makes the U.S. such an interesting case, as its performance during 1997-2004 was 1.0 percentage point greater than during 1971-1996, and 1.5 percentage points better than during 2005-2016. What is troubling, however, is that for 2010-2016, the U.S performance is barely half of the rate for the entire 2005-2016 period. Why has that happened? Does this performance foreshadow a problem for the future economic performance of the U.S., and in turn, the world?

Exhibit 10. GDP Growth Rates Vary By Country SOURCE: Productivity Paradox
Economists have found that they can usually only explain a portion of economic growth by the growth of inputs to production, such as the number of hours worked or the amount of capital utilized. The unexplained or residual portion of growth is presumed to come from advances in production technologies and business processes, and is attributed to all of the production factors together and is referred to as Total Factor Productivity (TFP) growth. Over the last 50-plus years, gains in TFP have accounted for over half the growth in measured growth of labor productivity. In other words, TFP has contributed more to the measure of labor productivity growth than the increase in the amount of capital per worker.

Exhibit 11. total Factor Productivity Growth In History SOURCE: Robert Shackelton, Congressional Budget Office
Labor productivity is impacted by TFP, as well as by capital deepening. The two factors contributed only half a percentage point each to labor productivity growth since 2004, against 1.7 percentage points for TFP and 1.2 for capital during 1995-2004. For the OECD, labor productivity growth fell from about 1.8 to 1.0 percentage point between 2000 and 2008, with most of the decline due to slowing TFP growth that fell from about 1.0 to 0.4 percentage points. In contrast, the post-2008 period has been marked by a further decrease in labor productivity growth, which can be entirely attributed to a slower growth of capital deepening, as shown by individual country experiences.
Several explanations for the slowdown of capital deepening have been suggested. The composition of capital is shifting towards assets with shorter lifetimes, which implies a higher aggregate scrapping rate. The increase in the scrapping rate has taken place since 1990, rising from a 3% to a 5% rate.
Another plausible explanation for the weak post-2008 investment is the fall in aggregate demand. Countries with lower pre-crisis interest rates, which may have contributed to more capital misallocation, experienced a stronger slowdown in capital growth following the crisis. Lastly, government investment, not to be confused with government spending, also fell post-2008. That drop contributed to around 20% of the fall in investment as a share of GDP. This latter trend is potentially troubling, as a lack of investment in infrastructure and public capital may have a longer-term impact on productivity.
A factor that has helped economic performance, as well as productivity improvement, was the downward trend in interest rates. We can see how much long-term and short-term interest rates have declined since they peaked in the late 1970s. While Exhibit 12’s chart ends in early 2015, we know that interest rates have remained as low, or even gone lower, since. Low interest rates allowed companies to borrow for investment cheaply, as well as reduce the hurdle rate to justify capital investment projects. Will interest rates remain as low in the future? Likely, they will remain low for the foreseeable future given the need to stimulate economies as we recover from the coronavirus economic lockdowns. But given the amount of public debt being added to fund economic stimulus, the cost of selling debt securities in the future may rise.

Exhibit 12. Is The Long Decline In Interest Rates Ending? SOURCE: Productivity Paradox
A chart on the ratio of government debt to each particular country’s GDP shows ratios from 1960 through early 2019. What stands out is the ratio for the U.S., especially since the 2008 data point noted in the chart. The other interesting trend is to study how Japan’s ratio has soared as the country embraced using its monetary authorities to monetize spending to stimulate its economy. This ratio’s rise has not helped Japan’s economic growth, which is why economists caution about huge debt increases creating another Japan. Debt ratios for 2020 for virtually every country will soar as government debt has exploded and GDPs are collapsing. Hopefully, the ratios will begin to decline starting in 2021.

Exhibit 13. Total Government Debt For 37 Countries SOURCE: BlackRock Investment Institute
When we examine the ratios of various country’s total non-financial debt – private and government – to GDP, we see how high they are. Private debt growth has been driven by the decline in interest rates and tax code changes that encouraged many companies to borrow money to buy back shares of stock. One has to worry about the impact on economies when, or if, investors decide they will not loan money to companies and governments at today’s interest rates.

Exhibit 14. total Private And Government Debt Of 37 Countries SOURCE: BlackRock Investment Institute
There is a theory that another contributing factor to recent low economic growth is due to a decline in technology’s contribution. The theory is often explained as a decline in innovation. It is believed that the impact of new technologies, such as cell phones and social media, are not as powerful a force behind economic growth as electricity and automobiles were during the first third of the 20th century. At that time, most technology improvements contributed to significant improvements in living standards, as shown in Exhibit 15. We call readers’ attention to the increase in life expectancy at birth during 1900-1940s compared to the 1990s and 2000s. As the items cited in the Main Sources of Growth for that earlier period – electricity, internal combustion engines, chemicals and telecommunications – were key to growing the economy and improving living standards. The information technology source of growth noted during 1990-2010 is associated with very low TFP growth as well as small changes in life expectancy at birth. Is information technology less impactful on the world’s economy, or is there another explanation?

Exhibit 15. TFP And Living Standards Improvements Over Time SOURCE: Robert Shackleton, Congressional Budget Office
There is a school of thought suggesting that the impact of information technology is too difficult to measure with traditional financial and economic tools. Possibly the pace of change coming due to the technology is so quick it can’t be easily measured. Therefore, the paradox of low productivity is a mismeasurement issue. This debate is impossible to resolve, other than to point to the huge growth in the stock market valuations of the leading technology companies. The counter to that theory explaining the mismeasurement challenge is that investors are prone to buy shares in companies they know and whose products they use. That investment approach was advocated by legendary growth fund manager Peter Lynch of Fidelity.

Exhibit 16. Computers Impact Economies Like Electrification SOURCE: The Oxford Martin School
The chart in Exhibit 16 shows an interesting comparison, which is being used to support the view about the lag in the impact of new technology on productivity and, in turn, on economic growth. The chart tracks the spread of the electric dynamo through the economy around the turn of the 20th century compared to the embrace of the computer (IT), which began impacting the economy in the 1970s. Notice that the paths of the two technologies is very tight, suggesting that if brought forward to 2020, IT will have penetrated the economy equally as the dynamo did.
Notice that the time necessary to fully benefit from a new technology may take upwards of 50 years. This is because it requires time for the technology to penetrate the economy, for companies and workers to adapt, and for complementary investments to take place. There is a significant time lag between the first key inventions in a General Purpose Technology (GPT) and its impact on aggregate productivity. The reason is because of the existence of old technologies in the existing capital stock. Old methods and old capital remain more efficient during the initial phases of GPT development, so firms have no financial incentive to switch early to the new technology. Thus, there needs to be complementary innovations, as well as improvements in the GPT, before it becomes the superior technology. These investments require time and are lumpy, and the larger and lumpier they are, the longer the lag.
A report in 2019 examined the issue of lagging productivity. The report, “The Productivity Paradox: Reconciling Rapid Technological Change and Stagnating Productivity,” was prepared by the Oxford Martin School Programme on Technological and Economic Change. In discussing the impact of the dynamo on the economy and productivity, the study stated:
“The improvement in the GPT itself can take decades, as was the case for the dynamo, which only superseded steam four decades after the first major inventions. The dynamo only started to have major productivity effects for the firms when a complete reorganization of factories was realized. Even then, not all firms switched to the superior technology immediately, but waited until old capital had depreciated before introducing large-scale changes to their production process. In all, old and new technologies and capital vintages may be expected to coexist for a long time before diffusion becomes widespread. The historical observations are complemented empirically with research showing that measured aggregate productivity growth first slows down for extended periods, before it picks up significantly.”
In discussing this issue, the authors pointed to how Amazon’s initial entry into bookselling impacted the small bricks-and-mortar booksellers. Initially, many of these small booksellers closed. Later, the surviving small booksellers figured out how to revamp their stores to meet the demands of customers and become relevant in order to succeed. Likewise, as we consider the possibility of artificial intelligence (AI) and autonomous vehicles, not only will the education system need to be reformed to train people with the right skills, but contracts and the judiciary system will need to be re-invented to deal with the responsibilities of these vehicles, especially as they come into conflict with human-operated vehicles. These examples were cited as justification for claiming that it is extremely hard to capture the productivity impact on the economy from these technologies in the data, especially while utilizing conventional financial measurement tools.
Not only is there mismeasurement of the data, but there is also a belief that while these new technologies are entering and diffusing through-out the economy, productivity naturally slows. The authors believe this is a more appropriate explanation for the productivity slowdown, rather than the absence of innovation. If it is the appropriate explanation, then productivity should be poised to accelerate. If an innovation shortage is the issue, then productivity likely will not improve much, and might even slow further. Which theory is right? Only time will resolve the issue.
In considering all these factors that influence economic growth, it becomes clear that some are beginning to change. Will these changes happen quickly, or take years to evolve? If the changes are materially different from their recent trends, one could argue that economic growth will be different than currently anticipated, and so will oil demand. The oil demand consideration further depends on government policies with respect to fueling the future economy. The rise of renewables is tied to both policy and social views, which are increasingly being put forth by elites. Their disproportionate influence in the debate is something to consider when thinking about our energy future.
As we think about the role of energy in society, we can turn to Mazlow’s hierarchy of needs pyramid for guidance. Energy is critical in the bottom two layers of the pyramid, which relate to the basic needs people require to live and prosper. Energy is also helpful as people work to achieve their psychological needs, the next two levels of the pyramid. Arriving at the top of the pyramid, people’s focus changes to becoming more creative, since all the other needs have already been met. Self-actualization needs play into the characterization of elites. Some elites have been targeted by social movements, as they are considered guilty of imposing their ideals on the masses, without considering either the cost or pain inflicted on others. Many elites use their status to dictate how society must evolve, including how one lives and works, again without considering the cost because these elites already have all the money they need. Many of the elites use their position to dictate how society should power its economy, and for them, everyone should only use clean, renewable fuels, without considering the cost and economic and social disruption such policies may/will bring. The more frustrating aspect of elites dictating policies, much like congressmen, is that they exempt themselves from having to adhere to the policies.

Exhibit 17. Mazlow’s Hierarchy Of Needs Pyramid SOURCE: Mazlow
There are many reasons why advocating clean energy is right for economies and societies, but when pushed without considering the costs, it may prove detrimental to growth and living standards. When natural gas was backed by elites as the clean alternative to dirty coal, carbon dioxide emissions fell. The progress made in reducing carbon emissions proved insufficient for some elites, who then determined that only wind and solar were satisfactory fuels for powering the economy. This policy ignores the intermittency of renewables, while hailing their carbon-free electricity output. Ignored are the environmental legacies that come from mining the rare earth minerals needed to manufacture the equipment needed to generate renewable electricity, the amount of energy and fossil fuels necessary to produce the equipment, and the environmental costs of their disposal. Batteries are offered as the optimal solution for the intermittency of renewables, but without calculating the costs associated with such a strategy, let alone the physical limitations on achieving 100% carbon-free energy. Also ignored is the clean electricity output of nuclear power plants.
Oil company executives, especially of oil companies based in Europe, are already thinking about the future for their business being meaningfully different from its recent past. What is driving the rethinking is the greater pressure from society, investors and government policymakers for companies to focus on sustainability of their companies and neighbors. This push has emerged in the environmental, social and corporate governance (ESG) movement. The role of companies – how they operate, how they govern themselves, and how they treat their customers, workers and communities – is receiving increased attention. While all of these constituents are the primary focus of CEOs and company boards, any perceived mistreatment receives public attention and shaming. People forget that successful companies always weigh the interests of all these constituents when creating and managing businesses.
BP plc CEO Bernard Looney announced during his recent earnings call with investors that the company’s transition to one less-focused on crude oil and natural gas and targeting more clean energy was necessary for achieving its commitment to be a net-zero carbon emissions company by 2050 or earlier. To fulfil this objective, it is undertaking a massive corporate overhaul in structure, operation and strategy. Two key tenets of the strategy shift were listed on BP’s web site. They were:
“Increasing low carbon investment to around $5 billion a year - 10 times what we invest today.
“Reducing our oil and gas production by over 40% and no exploration in new countries.”
If more energy producers follow BP’s example, the future oil and gas business will be quite different from what it is today. But will that be the correct move? Will such a dramatic transformation require 30 years, or might it happen quicker? Will the change be driven by companies in response to shifting social mores, or by government diktats? What does this mean about costs for both the companies and their customers and suppliers? Technology will play a key role, but will the impact require decades to change the industry? If the technology is as significant as the electric dynamo, there will be a dramatic impact on companies and the industry. But, if it is more like computers, maybe the change will take longer, with a slowing in economic growth during the early phase of its introduction. If that happens, it could lead to a reduction in living standards, and a regression in the quality of life, as well as human longevity, before the benefits kick in. Will future generations look back on this era and question why society rejected the fossil fuels that had for centuries successfully grown economics, improved living standards, and generally enhanced society, and instead decided to regress?